Summary
For more than a year, we’ve been pointing out on a regular basis how President Obama, his allies and his critics all misuse or even fabricate statistics to give voters a skewed picture of reality. This time we’ll just offer the accurate numbers.
Here — in a graphic suitable for framing, embossing, emailing to friends or posting on social media — is an accurate statistical picture of key changes that occurred since Obama took office in January 2009. The indicators are all derived from the most authoritative and up-to-date sources available.
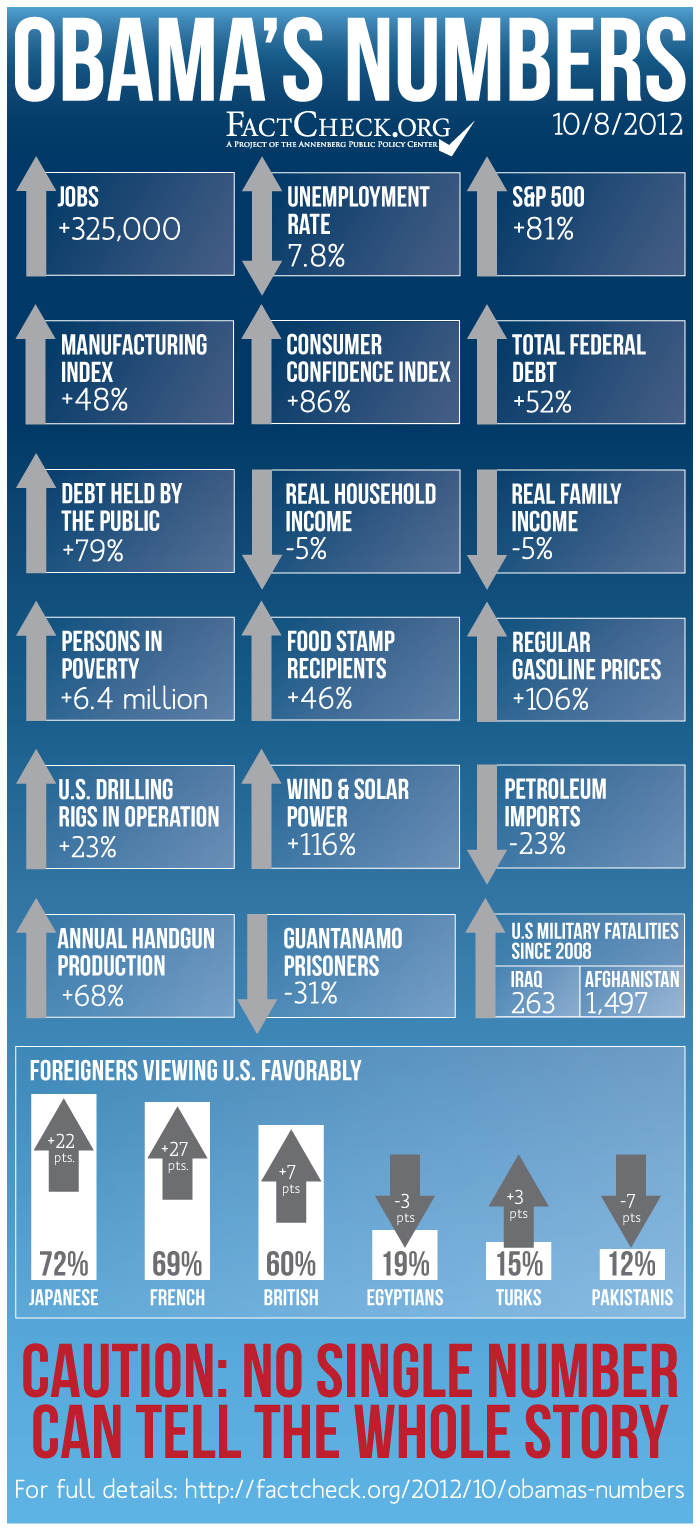
We’ve included the good, the bad and the indifferent — a booming stock market, a plunge in “real” (inflation-adjusted) household incomes, and a jobless rate that is exactly where it was when Obama took office. The U.S. dependence on foreign oil is down, but gasoline prices are up (though not quite as high as their high point under President Bush).
Opinions will differ on how much credit or blame a president deserves for things that happen during his time in office. And not everything can be reduced to a single number. Obama took office as the jobless rate was shooting up, for example. It peaked at 10 percent, and has drifted down since then. All of the 4 million jobs lost during his first 13 months in office have now been regained, plus about 300,000 more (counting the routine annual adjustment the Bureau of Labor Statistics has announced on a preliminary basis).
And some of the numbers here don’t reflect very recent changes. Income and poverty figures are for 2011, for example, and there’s reason to believe those are improving in 2012.
The stories behind each of these quick summary figures, plus hyperlinks to the official sources, are contained in the Analysis section.
Analysis
Unemployment & Jobs
According to the Bureau of Labor Statistics, the unemployment rate for January 2009, the month the president took office, was 7.8 percent. And that’s exactly where it stood in September 2012, too. But the more than three-and-a-half years in between have been a wild and painful ride.
The jobless rate was soaring when Obama took the oath of office. It had been as low as 4.9 percent in 2008, and it continued rising to a peak of 10 percent only nine months after he began his term. From there it took nearly two years to drift down to below 9 percent, and it remained above 8 percent until an unexpected drop of 0.3 percent in September.
The country was bleeding jobs at a rate not seen since the Great Depression — 818,000 jobs lost in January 2009 alone. (All before he took office on the 20th — the BLS measures payrolls as of the week containing the 12th day of the month.) All told, the economy had lost nearly 4.5 million jobs in the year before Obama became president, and it lost another 4.3 million before hitting bottom a year later, in February 2010.
Since then, the economy has slowly regained all the jobs lost, plus a few more. The BLS announced Sept. 27 that its routine annual benchmarking process would be adding about 386,000 jobs to the official figures for March 2012. That’s a preliminary figure, and the figures for March and all other months won’t be officially updated until after the election. But the final figures don’t vary much from the preliminary estimates. When that 386,000 is added to the historical figures, they show a net gain of 325,000 jobs between January 2009 and September 2012.
Stock Market
In stark contrast to the jobs market, the stock market has recovered much faster under Obama. The markets had gone into a nose dive in October 2007, triggered by the collapse of the housing bubble and the subsequent banking crisis. They continued to plunge during the worst economic recession since the Great Depression, which began in December 2007. Unlike the job market, stocks had nearly hit bottom by the time Obama took office, and they started to rise soon after.
Since January 20, 2009, the Dow Jones Industrial Average is up 70 percent, the Standard & Poor’s 500 index is up 81 percent, and the NASDAQ composite index (heavy with tech stocks) is up 119 percent. Although none has quite regained the historic highs reached in 2007, the gains have brightened the retirement prospects of millions of Americans who invest through 401(k) and similar tax-deferred plans, compared with the dark days of early 2009.
Economic Indicators
The future course of the economy is unpredictable, but there’s reason to think the economic expansion and job growth will continue, at least for a while. The most recent index of manufacturing activity, issued by the Institute for Supply Management, stood at 51.5 in September. Anything over 50 indicates expansion. The index stood at a dismal 34.9 when Obama took office. The number is 48 percent higher now than it was then.
Consumer confidence, as measured every month in a survey by the Conference Board, stood at 70.3 in September. This measure, which is watched as an indicator of consumers’ willingness to spend, jumped 9 points in September alone. It stood at 37.7 when Obama took office, so it has increased by 86 percent since then.
Federal Debt
Federal debt has soared under Obama, driven by a string of annual federal deficits exceeding $1 trillion each. As we reported in much detail back in June, the president inherited a gusher of red ink, which has continued despite his promise to cut deficits in half.
Since he took office, the total federal debt has reached nearly $16.2 trillion, an increase of 52 percent. That includes money that the government owes to itself, such as money held in the Social Security trust funds. It’s the figure the president’s critics cite most often.
The portion of that total debt that is owed to the public (including foreign investors) has risen even more dramatically in percentage terms. Debt held by the public now stands at $11.3 trillion, an increase of 79 percent.
Income and Poverty
Typical families and households have suffered financially since Obama took office, and poverty has increased.
Census figures show that real (inflation-adjusted) household income declined by $2,492, to a median figure of $50,054 in 2011, meaning that half of all households earned less than that, and half earned more. That figure is 4.7 percent below where it stood in 2008, the year before Obama took office.
Household income is the measure most often used, and it includes both families and persons living on their own. Real family income, which would include, for example, two-earner husband-wife families, is higher than household income. Family income also declined, by $3,290, to a median of $60,974 — a drop of 5.1 percent under Obama.
In fairness, real family and household incomes had been stagnant or declining for a decade before Obama’s term began. And there’s some evidence (see figure 3, page 10) that incomes are starting to rise in 2012. But the official Census figures for this year won’t be available until long after the election.
Falling incomes and high unemployment bring increased poverty. The number of Americans living below the federal government’s official poverty line stood at 46.2 million last year. (The figure was slightly higher in 2010 at 46.3 million.) That’s an increase of 6.4 million since 2008.
The poverty rate — the percentage of Americans living in poverty — also has gone up. It reached 15 percent last year, up from 13.2 percent in 2008 and 11.3 percent in 2000. But the rate ticked down last year from a recent peak of 15.1 percent in 2010. And the rate is not a record. It was 22.4 percent when the government first began measuring poverty in 1959.
Food Stamps
A rise in the number of persons on “food stamps” accelerated under Obama. This form of federal aid is now called the Supplemental Nutrition Assistance Program, and it no longer employs paper coupons but uses plastic cards similar to bank or credit cards.
The number getting this aid reached nearly 46.7 million in July, the most recent monthly figures available. That’s the highest number on record, and equal to nearly one of every seven Americans. It’s also an increase of just under 46 percent since January 2009.
Energy Indicators
The average price of regular gasoline at the pump, as any motorist is painfully aware, has been near historic highs for much of Obama’s term. According to the Energy Information Administration, the average was $1.85 the week ending Jan. 19, 2009. And it had more than doubled to $3.80 as of the week ending Oct. 1, 2012. That’s an increase of 106 percent, to be exact.
But as many will remember, the price was even higher in 2008, before the world economic slowdown sent petroleum prices plunging. The national average for regular gasoline topped $4 a gallon for seven weeks in the summer of 2008, hitting a record $4.11 in July of that year.
A more positive indicator is U.S. reliance on foreign oil. Oil imports peaked at more than 60 percent of U.S. consumption in 2005, under President Bush, but dependence began to decline the following year. The trend has continued under Obama. It dropped to just under 50 percent in 2010, and to 45 percent last year.
The U.S. is not only less dependent in percentage terms, it is buying less foreign oil, period. The amount of imported oil averaged 8.5 million barrels per day in 2011, a drop of 23 percent from 2008, according to EIA figures. And the EIA projects further declines in 2012 and 2013.
According to EIA experts, the decline is due to several factors, including reduced consumption and a boom in domestic oil production brought on by breakthroughs in drilling techniques. And the drilling boom continues. The number of rotary oil and gas drilling rigs in operation in the U.S. stood at 1,913 in August, an increase of 23 percent compared with the month Obama took office.
Wind and solar power also have surged under Obama. The total amount of electricity generated from wind and solar sources reached 121,561 thousand megawatt-hours last year, an increase of 116 percent from 2008. And the trend continues — wind and solar generation so far this year is running well ahead of the same period in 2011.
Guns
Gun sales have boomed under Obama, who did not deliver on campaign pledges to restore the “Assault Weapons Ban” that expired in 2004 or to require background checks for guns sold by non-dealers at gun shows. Reliable statistics on total sales don’t exist, but U.S. makers of firearms do report figures on new weapons produced each year.
Production of new handguns — revolvers and automatic pistols — topped 3 million last year, an increase of 68 percent over 2008. One factor behind the surge may be a series of groundless rumors that the administration is moving to ban guns. Another factor may be a fear among gun fanciers, fanned by the National Rifle Association, of what Obama might do if reelected.
War, Terrorism & World Opinion
The president wound down the war in Iraq, but expanded the war in Afghanistan. Meanwhile, he failed to close the military detention camp for suspected terrorists in Guantanamo Bay, Cuba, as he promised, but the number of persons held there has declined by nearly a third. And through all this, U.S. standing in world opinion remains low in most of the Muslim world, but has greatly improved in rich democracies in Europe and Asia.
Deaths of U.S. military personnel in Iraq all but ceased with the withdrawal of combat forces in December of last year. U.S. military fatalities associated with Iraq total 263 since 2008, according to a Department of Defense spokesman.
But 1,497 American troops have died in Afghanistan since 2008 — about 70 percent of all U.S. deaths there since that war began, 11 years ago. The president increased troop levels there in 2009, but has accomplished little: A negotiated deal with Taliban insurgents has been abandoned, according to a recent report in the New York Times.
The president reached out to the Muslim world, making a highly touted speech at Cairo University on June 4, 2009, in which he sought “a new beginning between the United States and Muslims around the world.” Nevertheless, public approval of the U.S. in key Muslim nations is quite low. According to the polling for the Pew Global Attitudes Project, only 12 percent of those in Pakistan have a favorable opinion of the United States in 2012, down 7 percentage points since 2008.
In Egypt, only 19 percent view the U.S. favorably this year, down 3 points since 2008. Favorable opinion in Turkey is even lower, at 15 percent, though it has risen 3 points under Obama.
The U.S. is seen favorably by 72 percent in Japan (up 22 points since 2008), 69 percent in France (up 27 percentage points) and 60 percent in Britain (up 7 points.)
These numbers provide only a sketch of what has occurred during Obama’s presidency. Readers may draw their own conclusions about how much credit or blame the president personally deserves for any of them. What we can vouch for is that these measures are the most recent available, from authoritative sources, and cover the time since Obama took the oath of office.
— by Brooks Jackson
Sources
U.S. Bureau of Labor Statistics. “Labor Force Statistics from the Current Population Survey.” Unemployment Rate. Accessed 5 Oct 2012.
U.S. Bureau of Labor Statistics. “Employment Situation News Release.” 5 Oct 2012.
U.S. Bureau of Labor Statistics. “Employment, Hours, and Earnings from the Current Employment Statistics survey (National).” Total nonfarm employment, seasonally adjusted. Accessed 5 Oct 2012.
U.S. Bureau of Labor Statistics. “Current Employment Statistics; Frequently Asked Questions.” Accessed 5 Oct 2012.
U.S. Bureau of Labor Statistics. “CES Preliminary Benchmark Announcement.” 27 Sep 2012.
National Bureau of Economic Research. “US Business Cycle Expansions and Contractions.” Accessed 5 Oct 2012.
Google Finance. “Dow Jones Industrial Average.” Historical prices. Accessed 5 Oct 2012.
Google Finance. “S&P 500.” Historical prices. Accessed 5 Oct 2012.
Google Finance. “NASDAQ Composite.” Historical prices. Accessed 5 Oct 2012.
Institute for Supply Management. “September 2012 Manufacturing ISM Report On Business.” 1 Oct 2012.
Institute for Supply Management. “ISM Manufacturing Report On Business Historical Information.” Accessed 5 Oct 2012.
Dooley, George. “Consumer Confidence Index Dips In January.” Travel Agent Central. 28 Jan 2009.
Jackson, Brooks. “Obama’s Spending, ‘Inferno’ or Not?” FactCheck.org. 4 Jun 2012.
U.S. Treasury, Treasurydirect.gov. “The Debt to the Penny and Who Holds It.” Accessed 5 Oct 2012.
U.S. Census Bureau. “Historical Income Tables: Households.” Table H-6, All Races. Accessed 5 Oct 2012.
U.S. Census Bureau. “Historical Income Tables: Families.” Table F-6, All Races. Accessed 5 Oct 2012.
Sentier Research. “Household Income Trends: August 2012.” 25 Sep 2012.
U.S. Census Bureau. “Table 2. Poverty Status of People by Family Relationship, Race, and Hispanic Origin: 1959 to 2011.” Accessed 5 Oct 2012.
U.S. Energy Information Administration. “Weekly U.S. Regular All Formulations Retail Gasoline Prices (Dollars per Gallon).” Accessed 5 Oct 2012.
U.S. Energy Information Administration. “Figure 114. Net import share of U.S. petroleum and other liquids consumption in three cases, 1990-2035 (percent).” Figure 114; Annual Energy Outlook, June 2012. Accessed 5 Oct 2012.
U.S. Energy Information Administration. “How dependent are we on foreign oil?” 13 Jul 2012.
U.S. Energy Information Administration. “Short Term Energy Outlook” (Custom Table Builder, Total Petroleum Net Imports, Annual). 11 Sep 2012.
U.S. Energy Information Administration. “U.S. Crude Oil and Natural Gas Rotary Rigs in Operation.” 5 Oct 2012.
U.S. Energy Information Administration. “Electric Power Monthly; Table 1.1.A. Net Generation by Other Renewables: Total (All Sectors), 2002-July 2012.” 24 Sep 2012.
U.S. Department of Agriculture. “Monthly Data — National Level:FY 2009 through July 2012.” 28 Sep 2012.
U.S. Bureau of Alcohol, Tobacco, Firearms and Explosives. “Annual Firearms Manufacturers And Export Report, 2011.” 10 Jul 2012.
U.S. Bureau of Alcohol, Tobacco, Firearms and Explosives. “Annual Firearms Manufacturers And Export Report, 2008.” 14 Jan 2010.
Gore, D’Angelo. “Still No International Gun Ban Treaty.” FactCheck.org. 27 Jun 2012.
The Associated Press. “Gun sales boom in expectation of Obama re-election.” Houston Chronicle. 4 Mar 2012.
National Rifle Association, Institute for Legislative Affairs. “Wayne LaPierre: Obama wants to outlaw guns in 2nd term.” 11 Feb 2012.
BBC News. “Last US troops withdraw from Iraq.” 18 Dec 2011.
Rosenberg, Matthew. “U.S. Abandoning Hopes for Taliban Peace Deal.” New York Times. 1 Oct 2012.
Balz, Dan. “High Expectations for Obama’s Cairo Speech.” Washington Post. 2 Jun 2009.
Obama, Barack. “Remarks by the President on a New Beginning.” The White House. 4 Jun 2009.
Pew Global Attitudes Project. “Global Opinion of Obama Slips, International Policies Faulted.” 13 Jun 2012.