In recent weeks, Treasury Secretary Janet Yellen and Sen. Tim Scott offered seemingly contradictory claims when discussing the impact of inflation on the typical American’s wages and income.
During prepared testimony to the House Ways and Means Committee on April 30, Yellen claimed that “real wages and household median wealth have increased since before the pandemic.” Similarly, in a June 13 interview with CNBC, she said that “all Americans, both those who are well off and those who are near the bottom of the income distribution, are better off now. Their wages have risen more than prices.”
Conversely, during a June 16 interview on ABC News’ “This Week,” Scott claimed that for the “working class coalition … under Joe Biden … their wages, frankly, have gone down. Costs have gone up. And they have less spending power.”
Both Scott and Yellen can cite economic data that support their claims. The difference between the two claims is that Scott analyzed changes in inflation-adjusted wages and incomes since President Joe Biden entered office in 2021, whereas Yellen began her analysis in 2019, arguing that the pandemic distorted evaluations that began when Biden entered office.
Measuring from the start of Biden’s term in office, both wages and incomes have not kept up with inflation. However, measuring from before the pandemic to the present, inflation-adjusted wages and incomes have slightly increased.
To analyze these claims, we asked multiple economists to evaluate whether it was more useful to measure changes in real wages and incomes under Biden by beginning in 2019 or 2021. The question elicited disagreement from the economists we interviewed.
Scott’s Timeline: 2021 to the Present
Since Biden entered office, three key macroeconomic metrics gauging the purchasing power of Americans through their wages and disposable income have each increased at a slower pace than inflation, supporting Scott’s claim.
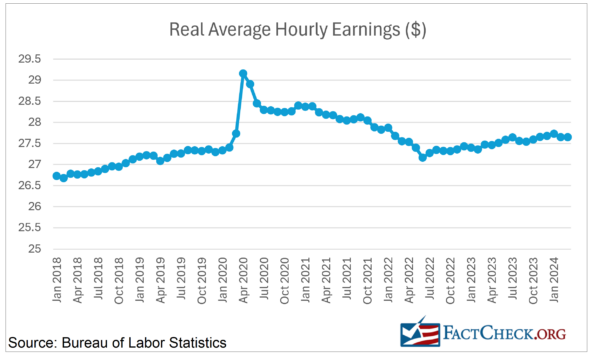
First, our analysis of Bureau of Labor Statistics data found that real average hourly earnings for all private sector employees have decreased by 2.24% between January 2021 to May 2024. [Technical point: For our analysis, we adjusted nominal average hourly earnings for inflation using the Consumer Price Index for All Urban Consumers for all items, with 2018 as the base year. CPI-U covers 87% of U.S. consumers.]
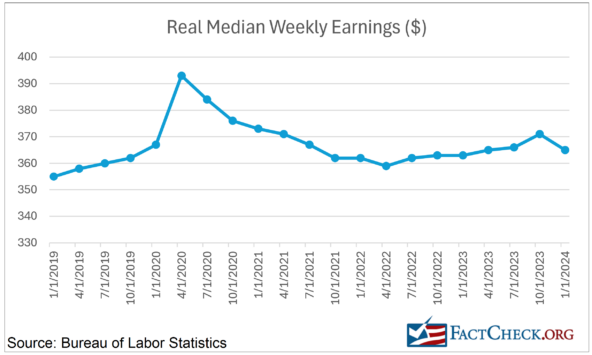
Second, quarterly data from the BLS identifies that real median weekly earnings for full-time workers (using 1982-1984 CPI-adjusted dollars) have decreased by 2.14% from the first quarter of 2021 to the first quarter of 2024.
Third, the Bureau of Economic Analysis identifies that real per-capita disposable personal income (using chained 2017 dollars) has decreased by 9.04% between the first quarter of 2021 and the first quarter of 2024.
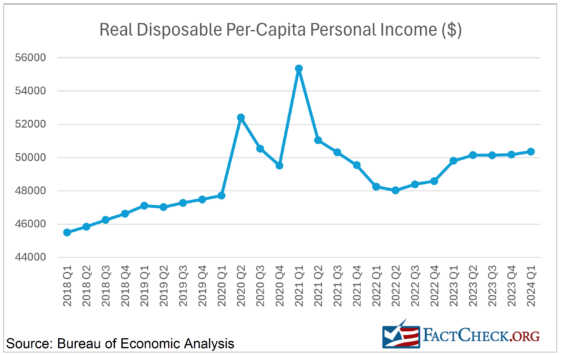
Real personal disposable per-capita income offers a different picture of purchasing power by including income sources other than earnings, such as “Social Security and other government benefits, dividends and interest, [and] business ownership.” As a result, Douglas Holtz-Eakin, president of the conservative-leaning American Action Forum and former director of the Congressional Budget Office, told us in a phone interview that income offers “a broader measure of purchasing power” than wages. According to the BEA, disposable income denotes the income “residents have left to spend or save after paying taxes.”
While Scott is correct that average hourly earnings have grown at a slower pace than inflation over the last three years, nominal wages have still increased for the typical American. The BLS estimates that nominal average hourly earnings (measured in current dollars without adjusting for inflation) have increased by 16.64% between January 2021 and May 2024.
Nevertheless, in each of the three macroeconomic metrics we’re using to evaluate purchasing power, Scott is correct that the typical American’s income and wages have failed to keep pace with inflation since Biden entered the presidency.
Yellen’s Timeline: 2019 to 2023
When asked to support Yellen’s claim, the Treasury Department cited two reports published by the CBO and the Treasury Department, which both identify increases in the average American’s purchasing power by analyzing changes in adjusted market income and weekly earnings, respectively. Unlike Scott, these studies identified increases in real wages between late 2019 and late 2023.
Biden made a similar claim to Yellen’s in an interview with Time Magazine on May 28, arguing that “wage increases have exceeded what the cost of inflation, which you’re talking about as the prices that were pre-COVID prices.”
By all the three measures we’ve evaluated, Biden and Yellen are correct.
Real average hourly earnings (calculated by adjusting nominal average hourly earnings for inflation using the CPI-U) increased by 1.20% between February 2020 and May 2024, while disposable per-capita real personal income increased by 6.06% between the fourth quarter of 2019 and the first quarter of 2024. Finally, real median weekly wages increased by 0.83% between the fourth quarter of 2019 and the first quarter of 2024. These findings support Biden’s claim that the average consumer possesses more purchasing power today than before the pandemic.
Recent short-term changes in consumer purchasing power also support Biden’s argument. Between May 2023 and May 2024, average hourly earnings growth has outpaced price increases, growing at an inflation-adjusted rate of 0.81%. Additionally, between the first quarter of 2023 and the first quarter of 2024, real disposable personal income per capita has increased by 1.11%. Finally, real median weekly wages increased by 0.55% between the first quarter of 2023 and the first quarter of 2024.
It’s worth noting that Yellen also addressed this issue during an interview on the same June 16 episode of “This Week” in which Scott argued that real wages decreased under Biden. During this show, Yellen attempted to repeat her earlier claim, but cited an incorrect timeframe — referring instead to the last three years.
“Well, it is true that, over the last roughly three years, there’s been a significant increase in the price level,” she said. “I would point out, of course, that wages have also gone up during this time, and government studies show that, for all — for households at all points in the income distribution wages have gone up somewhat more than prices.”
As we described earlier, from January 2021 to the present, the inflation-adjusted measures of average hourly earnings, median weekly earnings, and per-capita disposable personal income all decreased. Holtz-Eakin called Yellen’s claim from June 16 “demonstrably false.”
However, Yellen’s previous statement from April, and the evidence supporting her claim provided to us by the Treasury Department, all compare wage and income data from before the pandemic to the present and correctly identify an upward trend.
Impact of the Pandemic on Real Wage and Income
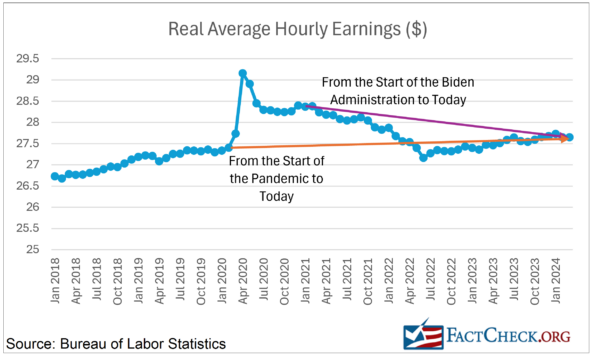
The different timeframes used by Scott and Yellen highlight the impact of the pandemic in altering measurements of the typical American’s purchasing power. In March 2020, when the World Health Organization declared a pandemic, all three of our reported metrics quickly spiked upward and subsequently declined in the following months.
When Yellen and Biden compare pre-pandemic real wage rates with present rates, they use a timeframe that predates the March 2020 spike. However, Scott’s timeframe begins at the start of 2021, after the peak of the spike.
Because of the distortionary effects of the pandemic, measurements of real wage and income growth starting from 2019 are significantly different from measurements beginning in 2021, as illustrated in the chart below.
Explaining the Disruptive Role of the Pandemic
Multiple economists’ explanations of these fluctuations in real wages and incomes during the pandemic focused on the exit and reentry of low-wage employees from the workforce. Biden’s CEA wrote in April 2021 that a “sharp, one-month increase in reported average wages” occurred early in the pandemic “because millions of relatively low-paid workers lost their jobs, while relatively high-paid workers remained employed.”
Holtz-Eakin corroborates that a “huge chunk” of the more than 20 million workers who lost their jobs early in the pandemic worked in “the leisure and hospitality and other sectors that have an abundance of low-skill, inexperienced workers.”
In a report by the Hamilton Project at the Brookings Institution, economists Chloe East, Wendy Edelberg, and Noadia Steinmetz-Silber write that “from February 2020 to April 2020, the unemployment rate increased by 15.4 percentage points for those with less than a high school education, compared to 6.5 percentage points for those with at least a bachelor’s degree.”
Dean Baker, senior economist for the Center for Economic and Policy Research, a labor-focused think tank, told us in an email that these changes in the labor market at the beginning of the pandemic were “comparable to telling the five shortest people to leave a room. The average height of the people remaining is greater, even though no one has gotten any taller.” As a result, he argues that “the rise in real wages at the start of the pandemic was an illusion.”
Subsequently, the Economic Policy Institute, a think tank partly funded by labor unions, argues that the U.S.’s recovery from the pandemic in the following months reversed this trend, driving real average wage growth down as many of these low-wage workers rejoined the labor force.
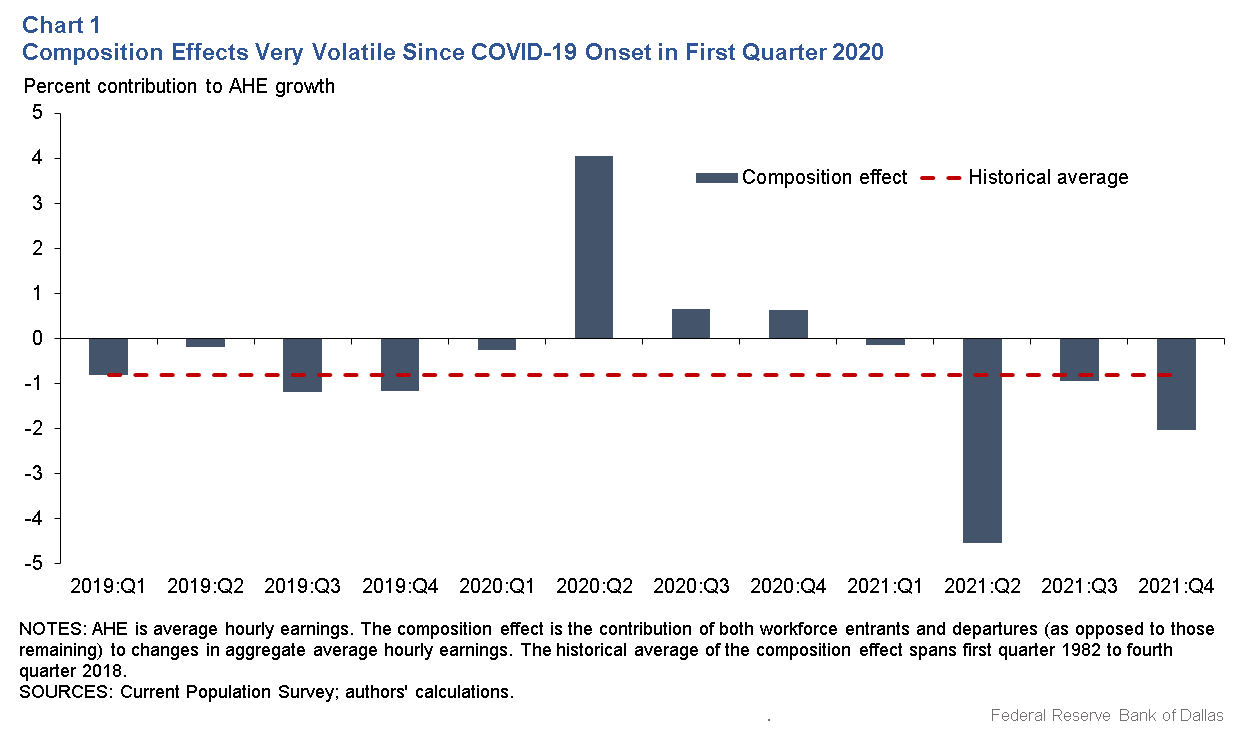
In a February 2022 report on the real wage gains over the two years of the pandemic, the Dallas Federal Reserve explained the impacts of these “composition effects,” which it defined as the “average wages of individuals who leave the workforce, compared with those who enter it over the period.”
The report identified an abnormally large positive composition effect driving up average hourly wages at the beginning of the pandemic. Subsequently, it also identified a large negative composition effect driving down average wages in the second quarter of 2021, which the report said resulted from the rapid reentry of low-wage workers into the labor force. (See the chart below from the report.)
Baker offered another explanation for the fluctuations in per-capita disposable personal income. In a February article for CEPR, he asserted that real per-capita income spiked in 2020 “primarily due to the pandemic checks” included in the CARES Act passed under then-President Donald Trump and the “$1,400 a person” stimulus from “Biden’s recovery package.” Holtz-Eakin refers to this roughly $5 trillion in total stimulus spending during the pandemic as an “enormous transfer to households.”
However, Baker said that “these programs mostly went away after 2021, which explains most of the drop in 2022.” He pointed out that 2021 “was also a year of sharp inflation, which outpaced wage growth for most workers. That further lowered real income.”
Therefore, selecting a timeframe that begins when Biden entered office, as Scott did in his interview with ABC News, includes this sharp drop in real per-capita disposable income in the middle of 2021.
When Should the Analysis Begin?
We’ve established that while real wages have increased since 2019, they have not grown since the beginning of the Biden administration. But how to evaluate purchasing power and real wages under Biden stirs a debate among some economists.
In an email message, a Treasury spokesperson argued that “the 2021 Bureau Labor of Statistics data on earnings was skewed and should not be used as a comparison point” because “the people out of the labor force at that time were disproportionally low-income such that the people that were working then skewed higher income. This made it look artificially like wages spiked in 2020 and remained elevated in 2021.” Instead, the spokesperson argued that “the comparison point that is more reliable for wage measurement is in 2019, just before the pandemic, when there was near full employment as there is today.”
When asked whether she felt it was more useful to begin an analysis of real wage growth under Biden in 2019 or 2021, Chloe East, a University of Colorado Denver Economics Professor and nonresident fellow with the Hamilton Project at Brookings, told us in a phone interview that the decision was something she and her peers at Brookings “struggled with.” Ultimately, they decided to begin their analysis in 2019 because it offered “more stable” data. “There were still changes in 2021,” she argues, making wage data from that year more “volatile” than 2019.
However, Holtz-Eakin disagrees with this approach. He argues that by the time Biden entered office, the president “inherited an economy that was growing rapidly and had recovered from the recession,” and that many of these low-skill workers had already reentered the labor force. He points to the unemployment rate, which had decreased from a pandemic high of 14.8% in April 2020 to 6.4% by the time Biden took office in January 2021. For context, the unemployment rate has stayed within the 3.4%-4% range between December 2021 and the present, and was 3.5% in February 2020. Therefore, Holtz-Eakin said he believed it is reasonable to begin his analysis of changes in real wages under Biden in January 2021, and not before the pandemic.
It’s worth noting that our evaluations of macroeconomic metrics under Biden published in the Biden’s Numbers quarterly reports generally evaluate data beginning with the start of his administration in January 2021.
Editor’s note: FactCheck.org does not accept advertising. We rely on grants and individual donations from people like you. Please consider a donation. Credit card donations may be made through our “Donate” page. If you prefer to give by check, send to: FactCheck.org, Annenberg Public Policy Center, P.O. Box 58100, Philadelphia, PA 19102.