Summary
President Joe Biden isn’t running for reelection, but his record will still be on the ballot in the fall. Here we look at how the U.S. has performed under the Democratic president:
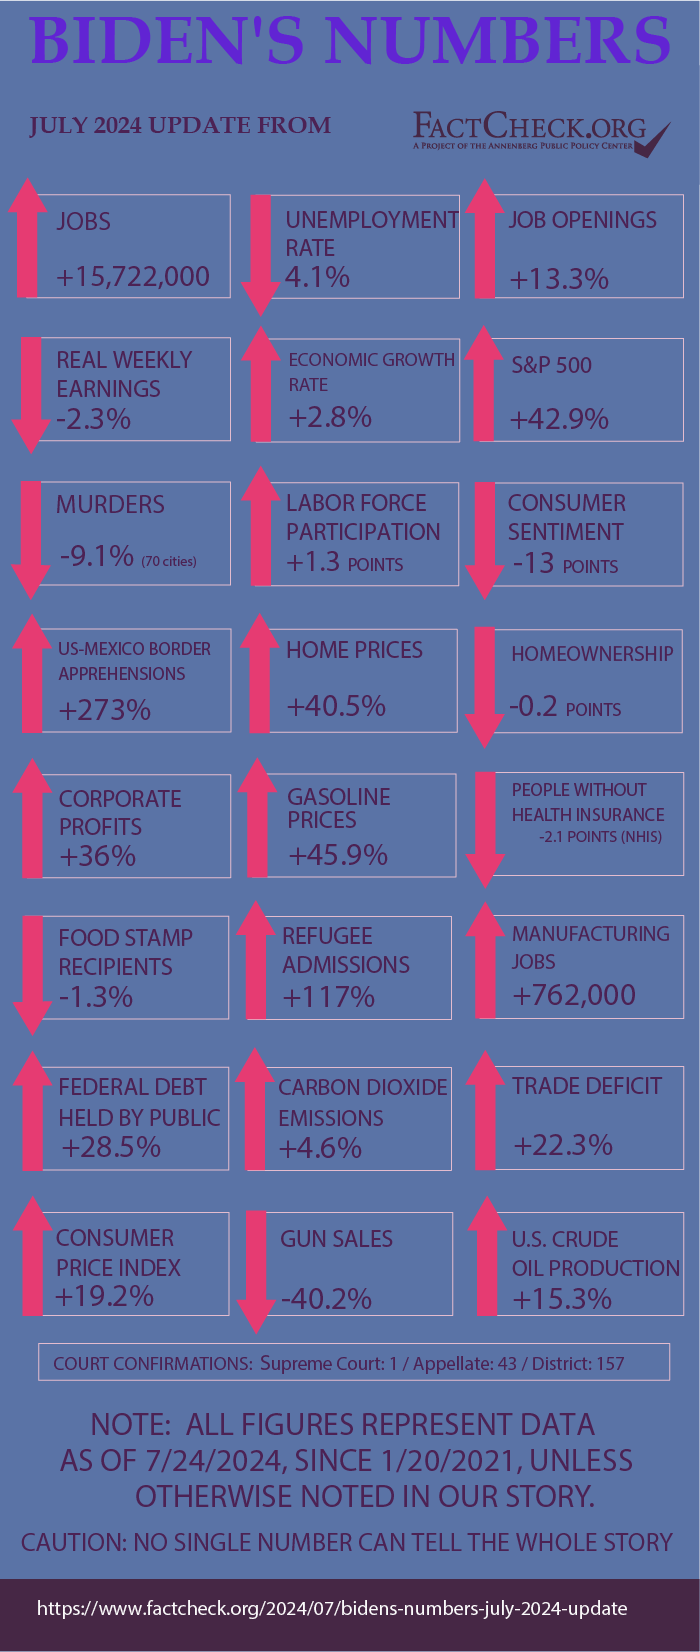
- The economy added 15.7 million jobs. The number is now 6.3 million higher than before the pandemic.
- The unemployment rate dropped back and has stayed lower, longer than at any time during the previous administration.
- Inflation surged to its highest level in over 40 years. Despite recent moderation, consumer prices are up more than 19% overall. Gasoline is up 46%.
- Average weekly earnings haven’t kept pace with prices. After adjusting for inflation, “real” weekly earnings dropped 2.3%.
- The U.S. economy has continued to expand under Biden, growing at 2.8% in the second quarter estimate released July 25 — double the rate of growth in the first quarter.
- Violent crime has gone down. Figures from large cities show a 9.1% drop in murders from 2020 to 2023, and data from more than 200 cities show a continuing decline so far this year.
- Fewer people lack health insurance. The uninsured went down by 2.1 percentage points or 6.6 million people.
- Crude oil production increased. The daily average for the most recent 12 months is 15.3% higher than the average in 2020, and it’s higher than the pre-pandemic average.
- Apprehensions of those trying to cross the southern border illegally are up 273% for the 12 months ending in June, even as the monthly figure for June dropped significantly.
- The average number of refugees admitted per month is 117% higher than the average under his predecessor.
- Corporate profits are up 36%.
- The international trade deficit for goods and services went up 22.3%.
- The number of people receiving food stamps has decreased by more than half a million.
- The debt held by the public has grown by 28.5%
- The S&P 500 has increased 42.9%.
Analysis
Our latest quarterly update of “Biden’s Numbers,” which we first published in January 2022, comes days after Biden dropped out of the presidential race and endorsed Vice President Kamala Harris. We’ll publish one more update in October, before Election Day.
We published similar reports on “Trump’s Numbers” throughout former President Donald Trump’s time in office.
We present various statistical indicators of how the country has fared. As we’ve said before, we make no judgments as to how much credit or blame the president deserves for these metrics, and we caution that no single number can tell the whole story.
Jobs and Unemployment
The number of people with jobs rebounded strongly during Biden’s time, surpassing pre-pandemic levels by more than 6 million.
Employment — The U.S. economy added 15,722,000 jobs between Biden’s inauguration and June, the latest month for which data are available from the Bureau of Labor Statistics. The June figure is 6,329,000 higher than the February 2020 peak of employment before COVID-19 forced massive shutdowns and layoffs.
Some occupations recovered more slowly, notably teaching. In June the number of local government education workers was only 29,000 higher than at the pre-pandemic peak. And employment in the leisure industry still hasn’t recovered; in June there were 161,000 fewer hotel and restaurant workers and others in the accommodation and food services industries than before the pandemic.
Unemployment — The unemployment rate has been lower for longer under Biden than under his predecessor.
It hit the lowest point in over half a century in January 2023 and again in April 2023, when it was 3.4%, the lowest since June 1969.
The rate was back up to 4.1% last month, still 2.3 percentage points below where it was when Biden took office.
June also marked the 32nd consecutive month that the rate was at or below 4.1%. The longest such stretch under Donald Trump was 27 months, just before the pandemic sent the unemployment rate soaring.
Job Openings — The number of unfilled job openings soared, reaching a record of over 12 million in March 2022, but then declined after the Federal Reserve began a steep series of interest rate increases aimed at cooling the economy to bring down price inflation.
The number of unfilled jobs was still over 8.1 million as of the last business day of May, the most recent month on record. That’s an increase of 955,000 openings — over 13% — compared with January 2021, when Biden took office.
In May, there was an average of nearly 3 jobs for every 2 people seeking work. When Biden took office there were fewer openings than unemployed job seekers.
The number of job openings in June is set to be released July 30.
Labor Force Participation — The labor force participation rate (the percentage of the total population over age 16 that is either employed or actively seeking work) has risen slowly during Biden’s time, from 61.3% in January 2021 to 62.6% in June.
That still leaves the rate 0.7 percentage points below the pre-pandemic level of 63.3% for February 2020.
The rate has been trending generally down for nearly a quarter of a century. It peaked at 67.3% during the first four months of 2000. Labor Department economists project that the rate will continue to slide down to 60.1% in 2031, “primarily because of an aging population.”
Manufacturing Jobs — During the presidential campaign, Biden promised he had a plan to create a million new manufacturing jobs — but that hasn’t yet been achieved.
As of June, the U.S. added 762,000 manufacturing jobs during Biden’s time, a 6.3% increase in the space of 41 months, according to the BLS.
But compared with the highest level during Trump’s time in office — which was in January 2019 — manufacturing jobs are up only 122,000, or just under 1%.
Wages and Inflation
CPI — Inflation came roaring back under Biden. During his time in office, the Consumer Price Index rose 19.2%.
For a time it was the worst inflation in decades. The 12 months ending in June 2022 saw a 9.1% increase in the CPI (before seasonal adjustment), which the BLS said was the biggest such increase since the 12 months ending in November 1981.
Inflation has moderated more recently. The CPI rose 3% in the 12 months ending in June, the most recent figure available.
Gasoline Prices — The price of gasoline shot up even faster.
During the week ending July 22, the national average price of regular gasoline at the pump was $3.47 per gallon. That’s $1.09 higher than in the week before Biden took office, an increase of 46%.
The price swung wildly during Biden’s first year and a half, hitting just over $5 per gallon in the week ending June 13, 2022. That’s the highest on record. The rise was propelled by worldwide supply and demand issues due to the COVID-19 pandemic and then by Russia’s invasion of Ukraine on Feb. 24, 2022.
Wages — Wages also have gone up under Biden, but not as fast as prices.
Average weekly earnings for rank-and-file workers went up 17% during Biden’s first 41 months, according to figures compiled by the BLS. Those production and nonsupervisory workers make up 81% of all employees in the private sector.
But inflation ate up all that gain and more. In June “real” weekly earnings, which are adjusted for inflation and measured in dollars valued at their average level in 1982-84, were still 2.3% below where they were when Biden took office.
That’s despite two years of recent improvement. Real earnings in June were 2.3% higher than the low point under Biden 24 months earlier.
Economic Growth
Despite concerns about high inflation and the Federal Reserve’s policy of raising interest rates to slow inflation, the U.S. economy has continued to expand under Biden.
The real gross domestic product (which is adjusted for inflation) increased 5.8% in 2021, 1.9% in 2022 and 2.5% last year.
In the second quarter of this year, the economy grew at an annual rate of 2.8%, the Bureau of Economic Analysis said in a July 25 release announcing its “advance estimate.” (The advance estimate is the BEA’s first estimate for the second quarter, which could be adjusted Aug. 29 when the second estimate is released.)
The 2.8% second quarter estimate was double the first quarter growth and was slightly higher than expectations. A day earlier, the Federal Reserve Bank of Atlanta’s GDPNow model was projecting growth of 2.6% for the quarter.
The BEA said the second-quarter figure “reflected increases in consumer spending, private inventory investment, and nonresidential fixed investment.” On the negative side, imports — “which are a subtraction in the calculation of GDP” — increased, the BEA said.
Prior to the release of the second-quarter estimate, economists were seeing signs of a slowdown in the U.S. economy that could shrink the growth rate in the near future.
In its monthly economic forecast issued July 11, the Conference Board – a research organization with more than 2,000 member companies – said it expected the U.S. economy “to lose momentum near-term as high prices and elevated interest rates sap domestic demand.”
Vanguard said something similar in its July economic outlook released July 18.
“The productivity and labor supply gains that drove U.S. economic growth in 2023 lately show signs of subsiding, joining retail sales, capital expenditure, and other data that previously suggested a slowdown,” Vanguard said.
Still, economists for both said the labor market is strong, and a recession – once thought inevitable – is unlikely. Vanguard projects that the U.S. economy will grow by 2% for the full year in 2024.
Crime
Contrary to claims by Trump and other Republicans, violent crime has gone down during Biden’s term. That’s according to crime data compiled by the FBI and other sources.
The 2022 FBI annual report showed a slight decline in the nationwide murder and nonnegligent manslaughter rate of 0.5 point from 2020, the year before Biden took office, to 2022. The violent crime rate dropped by 15.4 points, to 369.8 per 100,000 population in 2022. (For these figures, see Table 1 in the CIUS Estimations download for the crime in the U.S. reports.)
Preliminary FBI figures for 2023 and the first quarter of 2024 show further declines in violent crimes and murders. The number of violent crimes dropped 5.7% from 2022 to 2023, and from January to March of this year, violent crimes were down 15.2% compared with the same time period last year, according to the preliminary data (download the quarterly tables to see these figures). The FBI figures are based on voluntary reports by agencies nationwide.
The FBI’s official 2023 annual report should be released this fall.
Other reports show the same trend. Figures from the Major Cities Chiefs Association, with the addition of New York City’s statistics, show the number of murders has gone down by 10.4% from 2022 to 2023 in 70 large U.S. cities. Since 2020, murders in those cities have dropped by 9.1%.
The latest Major Cities Chiefs Association report, for the first quarter of 2024, indicate that murders and other violent crimes dropped again, compared with the same time period last year.
As of July 23, figures compiled by AH Datalytics, an independent criminal justice data analysis group, show a 17.3% decrease in murders in more than 200 U.S. cities so far this year, compared with the same point in 2023.
As we’ve explained in past reports, murders and violent crime went up in 2020, Trump’s last year in office, and there was a smaller increase the following year, Biden’s first as president. But since then, crime has been going down.
Health Insurance
The percentage of Americans lacking health insurance has declined by 2.1 percentage points under Biden, according to the National Health Interview Survey.
In 2023, 7.6% of the population was uninsured, according to the latest NHIS early release estimates. That’s down from 9.7% in 2020. In raw numbers, there were 6.6 million fewer people uninsured last year compared with the year before Biden became president.
The NHIS, a project of the National Center for Health Statistics at the CDC, measures the uninsured at the time people were interviewed.
The Census Bureau’s annual reports, which measure those who lacked insurance for the entire year, show the uninsured decreased by 0.7 percentage points or 2.4 million people from 2020 to 2022. The 2023 annual report should be released in September.
We have been noting in these reports that the uninsured figures could begin to rise, since some Medicaid provisions that were enacted during the COVID-19 pandemic started to be phased out at the end of March 2023. But so far, the available figures haven’t shown that. The latest NHIS report found the number and percentage of the uninsured declined from 2022 to 2023, though not significantly.
Under Biden, enrollment in the Affordable Care Act’s marketplace plans has gone up by 10 million people. The administration enacted increased subsidies for ACA plan premiums. The expanded subsidies expire at the end of 2025.
Crude Oil Production and Imports
For the most recent 12 months ending in April, the Energy Information Administration reported that average crude oil production in the U.S. increased to roughly 13 million barrels per day. That was about 15.3% more than the daily amount of crude oil produced on average in 2020. It’s also higher than the pre-pandemic average of 12.3 million barrels per day in 2019, which was the previous record.
As we noted three months ago, the EIA has said that oil production, despite declining drilling activity, has reached all-time highs during the Biden administration because new oil wells are more efficient due to advances in horizontal drilling and hydraulic fracturing technologies. In fact, the U.S. is currently producing more crude oil than any nation in history, the EIA said in March, citing data from its International Energy Statistics.
The EIA projects that U.S. crude oil production will continue to break records. In its Short-Term Energy Outlook for July, the agency said it expects production to average 13.2 million barrels per day in 2024 and 13.8 million barrels a day in 2025.
Even though the country is still producing more crude oil than ever, as well as exporting more of it, U.S. imports are still up under Biden. Over the last 12 months through April, the U.S. imported an average of more than 6.5 million barrels of oil per day. That’s higher than any annual daily average during Biden’s term, and it’s about 12% above the 2020 average of approximately 5.9 million barrels daily. Notably, however, the average over the last 12 months is still below the annual average of 6.8 million barrels per day in 2019, before the start of the pandemic.
Immigration
Looking at the number of apprehensions of those trying to cross the southern border illegally over the last year under Biden, the numbers remain historically high. But there are indications that is changing, as apprehensions plummeted in June after Biden implemented some new emergency policies to deal with high levels of illegal immigration.
To even out the seasonal changes in border crossings, we compare the most recent 12 months on record with the year before Biden took office. And for the past 12 months ending in June, the latest figures available, apprehensions totaled 1,894,715, according to Customs and Border Protection. That’s 273% higher than during Trump’s last year in office.
But the monthly number of apprehensions dropped to 83,536 in June, a little less than half the monthly average during Biden’s term, and the lowest total for a full month under Biden. (January 2021 was lower, 75,316, but Trump was still president for most of that month.)
On June 4, Biden announced a series of executive actions designed to address “substantial levels of migration” due to “global conditions” including “failing regimes and dire economic conditions,” “violence linked to transnational criminal organizations” and “natural disasters” in some countries in Central and South America. Specifically, the proclamation directs border officials to temporarily restrict asylum eligibility and promptly remove many who cross the border illegally between ports of entry when the daily average of encounters reaches 2,500 or more for seven straight days. The policy was immediately implemented on June 5 because levels were already well above that. (For more on the policy, see our story “Q&A on Biden’s Border Order.”)
Three weeks later, on June 26, Homeland Security Secretary Alejandro Mayorkas reported that Border Patrol encounters of migrants had decreased by over 40% after the new policy was enacted and that in those three weeks more than 24,000 migrants had been removed or returned by the Department of Homeland Security.
There is some early indication the July number may drop even lower. A White House official told us via email that the seven-day average of southwest border encounters between legal ports of entry was 1,838 as of July 11. If it stays at that level, the July number could be lower than any of Trump’s final three months. (The temporary restrictions directed by Biden will continue until 14 calendar days after the daily average of people apprehended crossing the border illegally drops to 1,500 encounters or less for seven consecutive days.)
Refugees
With three months left in fiscal year 2024, the Biden administration has already admitted more refugees than any administration has since 2016.
Still, the administration is likely to fall short once again of the president’s ambitious campaign promise to accept up to 125,000 refugees a year.
On Sept. 29, the Biden administration set the cap on refugee admissions for fiscal year 2024 at 125,000 – just as it did in fiscal years 2023 and 2022.
The administration admitted only 25,465 refugees in FY2022 and 60,014 in FY2023. In the first nine months of FY2024, the U.S. has admitted 68,291 refugees, according to State Department data.
In a November report to Congress, the State Department said it is making “significant progress” toward Biden’s goal for refugee admissions after “intensive efforts to restore, strengthen, and modernize the U.S. Refugee Admissions Program.”
Overall, the U.S. has admitted 163,778 refugees in Biden’s first full 41 months in office, or nearly 4,000 refugees per month, the department’s data show. That’s 117% higher than the 1,845 monthly average under Trump, who drastically reduced the admission of refugees. The Trump administration admitted only 86,731 refugees in four years. (For both presidents, our monthly averages include only full months in office, excluding the month of January 2017 and January 2021, when administrations overlapped.)
Consumer Sentiment
After showing some life in the beginning of the year, consumer confidence in the economy is slipping again.
The University of Michigan’s Surveys of Consumers reported that its final Index of Consumer Sentiment for January was 79 — the highest since July 2021. It remained little changed through April, historical survey data show.
But consumer sentiment dropped in May and has inched downward ever since. The preliminary index of consumer sentiment in July was 66 — continuing a trend that Joanne W. Hsu, director of the Surveys of Consumers, described as “stubbornly subdued.”
“Although sentiment is more than 30% above the trough from June 2022, it remains stubbornly subdued,” Hsu said in a press release. “Nearly half of consumers still object to the impact of high prices, even as they expect inflation to continue moderating in the years ahead.”
As Hsu referenced, the preliminary July figure is 16 points higher than the low under Biden, which occurred in June 2022. But it is also 13 points lower than January 2021, when Biden took office and the index was 79, the data show.
The Conference Board’s Consumer Confidence Survey also reported that consumer confidence weakened in June.
Corporate Profits
After dipping slightly in 2023, after-tax corporate profits resumed their upward trajectory.
For the year, after-tax corporate profits set records in 2021 and 2022, according to Bureau of Economic Analysis estimates. (See line 45.) The BEA estimated that profits in 2023 were $2.97 trillion — slightly lower than $2.98 trillion in 2022. Still, it was 36% higher than in 2020, the year before Biden took office.
However, corporate profits were running at an annual rate of nearly $3.17 trillion in the first quarter of 2024, according to the BEA’s most recent estimate.
Trade
As of May, the U.S. goods and services deficit over the last 12 months was $799.3 billion, according to figures the Bureau of Economic Analysis published in early July. The trade deficit that period was roughly $145.6 billion higher, or about 22.3% more, than in 2020.
The international trade gap in the most recent 12-month period is about $14.4 billion more than the calendar year 2023 deficit of $784.9 billion, which dropped nearly 17% from the record gap of nearly $944.8 billion in 2022.
So far this year, imports of goods and services have exceeded exports by about $14.4 billion, the BEA said, contributing to the increase in the trade deficit over the last 12 months.
Food Stamps
Under Biden, fewer people are receiving benefits from the program formerly known as food stamps.
In April, the most recent figures available, there were nearly 41.6 million beneficiaries receiving food assistance through the Supplemental Nutrition Assistance Program, according to preliminary statistics released July 12 by the Department of Agriculture.
At that time, SNAP enrollment had declined by 532,135, or nearly 1.3%, since Biden took office – although, April was the third consecutive month in which there was an increase in program participants. It’s been about two years since there were fewer than 41 million SNAP beneficiaries under Biden.
Debt and Deficits
Debt — The public debt, excluding money the government owes itself, increased to approximately $27.8 trillion, as of July 22. The public debt is now up almost 28.5% during Biden’s presidency.
Deficits — The Congressional Budget Office estimates that so far the budget deficit for fiscal year 2024 has declined slightly compared with the same period in the 2023 fiscal year, when the annual deficit was $1.7 trillion, according to the Department of Treasury.
Through the first nine months of the current fiscal year (October to June), the deficit was $1.3 trillion, or “$118 billion less than the deficit recorded during the same period last fiscal year,” the CBO reported in its Monthly Budget Review for June.
However, the agency is still projecting that the overall deficit for the 2024 fiscal year will be at least $1.9 trillion, which would grow to $2 trillion if adjusted to exclude the effects of shifts in the timing of certain payments. CBO said its estimate includes “costs that have not yet been recorded,” such as potential outlays due to the cancellation of student loan debt as well as financial assistance to Israel, Ukraine and Indo-Pacific nations.
Stock Markets
The S&P 500, which is made up of 500 large-cap companies, and the Dow Jones Industrial Average, which includes 30 large corporations, set new highs this month.
Even after a dreadful day for the market on July 24, the S&P is 42.9% higher than it was on Jan. 19, 2021, the day before Biden took office.
The Dow has seen smaller gains than the S&P 500. It has increased 28.8% under Biden — not much different from our last report.
The technology-heavy Nasdaq composite index, which is made up of more than 2,500 companies, has experienced a strong quarter since our last report. Overall, it was up 31.4% under Biden, closing on July 24 at 17,342.41 — up more than 1,700 points since our April quarterly report.
Home Prices & Homeownership
Home prices — High mortgage rates put a chill on home prices for a while, but the cost of existing single-family homes in the U.S. have started to climb to record heights once again.
The preliminary median sales price of existing single-family homes in June was $432,700 — setting a new record and marking the fifth straight month of price increases, according to the National Association of Realtors.
Prices previously peaked under Biden at $420,900 in June 2022 – a record high at the time that was topped in May and June of this year, the NAR data show.
The preliminary June figure is a staggering 40.5% higher than the $308,000 median home price in January 2021, when Biden took office.
Home prices began to fall in part due to rising mortgage rates. In its ongoing attempt to slow inflation, the Federal Reserve raised its benchmark rate in July 2023 for the 11th time since March 2022. In its latest economic outlook, which was released July 22, the investment research firm Morningstar forecast that the Fed will begin to cut rates by the end of 2024.
In our April report, we noted that the 30-year fixed rate mortgage average nationwide, as of April 18, topped 7% for the first time this year, according to Freddie Mac. The rate is currently 6.77% – which is below the historical norm of 7.74%, which is the weekly average rate since April 1971.
Homeownership — Homeownership rates have barely budged under Biden.
The homeownership rate, which the Census Bureau measures as the percentage of “occupied housing units that are owner-occupied,” was 65.6% in the first quarter of 2024 — a shade below the 65.8% rate during Trump’s last quarter in office.
The rate under Trump peaked in the second quarter of 2020 at 67.9%, but the U.S. Department of Housing and Urban Development’s Office of Policy Development and Research warns that data from the second quarter of 2020 through the third quarter of 2021 “should be viewed with caution” because restrictions during the COVID-19 pandemic “prevented normal data collection.”
“These changes in survey methods,” including the suspension of in-person surveys in the second quarter of 2020, “likely contributed to wide swings in the data,” HUD’s policy and research arm says on its website. “For example, there was a sharp increase and following decline in the homeownership rate during that time frame. The national homeownership rate, at 65.3 percent in the first quarter of 2020, was estimated to have jumped to 67.9 percent in the second quarter of 2020 and decline to 65.4 percent by the second quarter of 2021.”
For this reason, the Census Bureau has warned against making comparisons with the fourth quarter of 2020.
The highest homeownership rate on record was 69.2% in 2004, when George W. Bush was president.
Gun Sales
The latest estimates from the National Shooting Sports Foundation suggest that gun purchases again declined during the second quarter of 2024.
Since the federal government doesn’t collect data on gun sales, the NSSF, a gun industry trade group, estimates gun sales by tracking the number of background checks for firearm sales based on the FBI’s National Instant Background Check System, or NICS. The NSSF-adjusted figures exclude background checks unrelated to sales, such as those required for concealed-carry permits. The data “provide an additional picture of current market conditions,” the NSSF says.
The group has reported that the NSSF-adjusted NICS total for background checks during the second quarter of the year was nearly 3.4 million, which is down 7.9% from almost 3.7 million from the same period last year. It’s also roughly 40% lower than the more than 5.6 million in Trump’s last full quarter in 2020.
Through the first six months of 2024, there were over 7.3 million background checks for firearm sales. That’s the lowest total in the first half of the year since there were about 6.2 million in 2019.
Carbon Emissions
In the most recent 12 months on record, there were about 4.80 billion metric tons of emissions from the consumption of coal, natural gas and petroleum products in the U.S., according to the EIA’s latest estimates. That’s up over 4.6% from the almost 4.58 billion metric tons that were emitted in 2020, but still below the pre-pandemic total of about 5.15 billion metric tons emitted in 2019.
As of this month, the EIA forecast that there will be about 4.82 billion metric tons of emissions from energy consumption in 2024, which would be an increase of less than 1% from the 2023 total. The agency said the consumption of more jet fuel and diesel is expected to be “the largest driver of emissions increases” in 2024 and 2025.
Judiciary Appointments
Supreme Court — Supreme Court Justice Ketanji Brown Jackson was appointed by Biden and confirmed by the Senate on April 7, 2022. She replaced retired Justice Stephen G. Breyer, an appointee of President Bill Clinton. Trump had won confirmation for two Supreme Court justices at the same point of his tenure.
Court of Appeals — Biden has won confirmation for 43 U.S. Court of Appeals judges. Trump had won confirmation for 53 at the same point of his term.
District Court — Biden has won confirmation for 157 District Court judges (our count includes confirmation for the reappointment of the chief judge of the District Court for the Northern Mariana Islands). At the same point in his presidency, Trump had won confirmation for 144 District Court judges.
Five U.S. Court of Federal Claims judges have also been confirmed under Biden, while five had been confirmed at the same point of Trump’s presidency. Each man had won the confirmation for two U.S. Court of International Trade judges at this stage of their terms.
As of July 24, there were 48 federal court vacancies, with 12 nominees pending.
Editor’s note: FactCheck.org does not accept advertising. We rely on grants and individual donations from people like you. Please consider a donation. Credit card donations may be made through our “Donate” page. If you prefer to give by check, send to: FactCheck.org, Annenberg Public Policy Center, P.O. Box 58100, Philadelphia, PA 19102.
Sources
U.S. Bureau of Labor Statistics. “Employment, Hours, and Earnings from the Current Employment Statistics survey (National): Total Nonfarm.” Accessed 14 Jul 2024.
U.S. Bureau of Labor Statistics. “Labor Force Statistics from the Current Population Survey: Unemployment.” Accessed 14 Jul 2024.
U.S. Bureau of Labor Statistics. “Job Openings and Labor Turnover Survey: Job Openings.” Accessed 14 Jul 2024.
U.S. Bureau of Labor Statistics. “Labor Force Statistics from the Current Population Survey: Labor Force Participation Rate.” Accessed 14 Jul 2024.
U.S. Bureau of Labor Statistics. Monthly Labor Review. “Projections overview and highlights, 2021–31” Nov 2022.
U.S. Bureau of Labor Statistics. “Employment, Hours, and Earnings from the Current Employment Statistics survey (National): Manufacturing.” Accessed 14 Jul 2024.
U.S. Bureau of Labor Statistics. “Employment, Hours, and Earnings from the Current Employment Statistics survey (National): Manufacturing.” Accessed 14 Jul 2024.
U.S. Bureau of Labor Statistics. “Consumer Price Index – All Urban Consumers (Seasonally Adjusted).” Data extracted 14 Jul 2024.
U.S. Bureau of Labor Statistics. Consumer Price Index Summary. News release. 13 Jul 2022.
U.S. Energy Information Administration. “Weekly U.S. Regular All Formulations Retail Gasoline Prices.” Data extracted 23 Jul 2024.
Bureau of Labor Statistics. “Employment, Hours and Earnings from the Current Employment Statistics survey (National); Average Weekly Earnings of Production and Nonsupervisory Employees, total private.” Data extracted 14 Jul 2024.
Bureau of Labor Statistics. “Employment, Hours and Earnings from the Current Employment Statistics survey (National); Average Weekly Earnings of Production and Nonsupervisory Employees, 1982-1984 dollars, total private.” Data extracted 14 Jul 2024.
U.S. Energy Information Administration. “Short-Term Energy Outlook, July 2024.” 9 Jul 2024.
U.S. Energy Information Administration. U.S. Field Production of Crude Oil. Accessed 23 Jul 2024.
U.S. Energy Information Administration. “United States produces more crude oil than any country, ever.” 11 Mar 2024.
U.S. Energy Information Administration. U.S. Imports of Crude Oil. Eia.gov. Accessed 23Jul 2024.
National Association of Realtors. “Sales Price of Existing Single-Family Homes.” 23 Jul 2024.
National Association of Realtors. “Sales Price of Existing Single-Family Homes.” 20 Jul 2023.
National Association of Realtors. “Sales Price of Existing Single-Family Homes.” 22 Dec 2021.
Tepper, Taylor and Benjamin Curry. “Federal Funds Rate History 1990 to 2023.” Forbes Advisor. 17 Oct 2023.
Rugaber, Christopher. “Federal Reserve raises rates for 11th time to fight inflation but gives no clear sign of next move.” Associated Press. 16 Jul 2023.
“Mortgage Rates Exceed 7 Percent for the First Time this Year.” Press release. Freddie Mac. 18 Apr 2024.
“Mortgage Rates Continue to Fall.” Press release. Freddie Mac. 18 Jul 2024.
Tracey, Melissa Dittman. “5 Market Opportunities as Home Sales Eye Turnaround.” Realtor Magazine. 23 Jul 2024.
Tracey, Melissa Dittman. “Market is Shifting Slowly in Buyers’ Favor.” Realtor Magazine. 23 Jul 2024.
Caldwell, Preston. “When Will the Fed Start to Cut Interest Rates?” Morning Star. 22 Jul 2024.
U.S. Census Bureau. “Business and Industry: Homeownership rates.” Accessed 24 Apr 2024.
Mateyka, Peter, and Mazur, Christopher. “Homeownership in the United States: 2005 to 2019.” U.S. Census Bureau. Mar 2021.
U.S. Department of Housing and Urban Development. “Ownership and Vacancy — Homeownership Rate.” Undated, accessed 24 Jul 2024
U.S. Census Bureau. “Quarterly Residential Vacancies And Homeownership, Fourth Quarter 2021.” 2 Feb 2022.
U.S. Bureau of Economic Analysis. “National Income by Type of Income.” 27 Jun 2024.
University of Michigan. “Preliminary Results for July 2024.” Surveys of Consumers. 16 Jul 2024.
University of Michigan. “Final Results for January 2024.” Surveys of Consumers. 12 Feb 2024.
Conference Board. “US Consumer Confidence Weakens Slightly in June.” Press release. 25 Jun 2024.
U.S. State Department. “Presidential Determination on Refugee Admissions for Fiscal Year 2022.” 8 Oct 2021.
“The Biden Plan for Securing Our Values as a Nation of Immigrants.” Biden campaign. Undated, accessed 5 Jan 2022.
White House. “Presidential Determination on Refugee Admissions for Fiscal Year 2023.” 27 Sep 2022.
State Department. “Presidential Determination on Refugee Admissions for Fiscal Year 2024.” 29 Sep 2023.
State Department. “Report to Congress on Proposed Refugee Admissions for Fiscal Year 2024.” 3 Nov 2023.
State Department. “Admissions & Arrivals.” Refugee Processing Center. 30 Jun 2024.
“U.S. Annual Refugee Resettlement Ceilings and Number of Refugees A
U.S. Bureau of Economic Analysis. U.S. Trade in Goods and Services, 1960-present. Accessed 23 Jul 2024.
U.S. Bureau of Economic Analysis. “U.S. International Trade in Goods and Services, May 2024.” 3 Jul 2024.
U.S. Department of Agriculture. Supplemental Nutrition Assistance Program. Persons, Households, Benefits, and Average Monthly Benefit per Person & Household. 12 Jul 2024.
U.S. Department of Treasury. Debt to the Penny. Accessed 24 Jul 2024.
Congressional Budget Office. “Monthly Budget Review: June 2024.” 8 Apr 2024.
The Shooting Wire. “NSSF-Adjusted NICS Background Checks for April 2024.” 3 May 2024.
The Shooting Wire. “NSSF-Adjusted NICS Background Checks for May 2024.” 5 Jun 2024.
The Shooting Wire. “NSSF-Adjusted NICS Background Checks for June 2024.” 3 Jul 2024.
U.S. Energy Information Administration. “Monthly Energy Review, June 2024.” Table 11.1 Carbon Dioxide Emissions From Energy Consumption by Source. 25 Jun 2024.
Yahoo! Finance. “NASDAQ Composite.” Accessed 24 Jul 2024.
Yahoo! Finance. “Dow Jones Industrial Average.” Accessed 24 Jul 2024.
Yahoo! Finance. “S&P 500.” Accessed 24 Jul 2024.
Han, Lisa Kailai. “S&P 500, Nasdaq tumble for worst day since 2022 as Tesla, Alphabet slide after quarterly results: Live updates.” CNBC. 24 Jul 2024.
Keisler-Starkey, Katherine et. al. “Health Insurance Coverage in the United States: 2022.” Census Bureau. Sep 2023.
Keisler-Starkey, Katherine et. al. “Health Insurance Coverage in the United States: 2021.” Census Bureau. 13 Sep 2022.
Tolbert, Jennifer and Meghana Ammula. “10 Things to Know About the Unwinding of the Medicaid Continuous Enrollment Provision.” KFF. 5 Apr 2023.
Centers for Disease Control and Prevention; National Health Interview Survey. “Health Insurance Coverage: Early Release of Estimates From the National Health Interview Survey, 2023.” Jun 2024.
Department of Health and Human Services. “Health Insurance Marketplaces 2024 Open Enrollment Report.” 22 Mar 2024.
Centers for Medicare & Medicaid Services. “How did the American Rescue Plan (ARP) and the Inflation Reduction Act change Marketplace premium tax credits?” 5 Sep 2023.
Federal Bureau of Investigation. Crime Data Explorer. Quarterly Uniform Crime Report data, January through March 2024. 10 Jun 2024.
Federal Bureau of Investigation. “UCR Summary of Crime in the Nation, 2022.” Oct 2023.
Federal Bureau of Investigation. Crime Data Explorer. Crime in the United States Annual Reports, CIUS estimations, Table 1. accessed 24 Jul 2024.
Major Cities Chiefs Association. Violent Crime Survey — National Totals, January 1 to December 31, 2023, and 2022. Accessed 22 Jan 2024.
Major Cities Chiefs Association. Violent Crime Survey — National Totals, January 1 to December 31, 2020, and 2019. Accessed 22 Jan 2024.
Major Cities Chiefs Association. Violent Crime Survey — National Totals, January 1 to March 31, 2024, and 2023. Accessed 24 Jul 2024.
New York City government. New York Police Department historical crime data. Seven Major Felony Offenses, 2000 to 2023. accessed 24 Jul 2024.
AH Datalytics. YTD Murder Comparison. accessed 24 Jul 2024.
United States Courts. Confirmation Listing, Judicial Confirmations for January 2023, 117th Congress. Updated 1 Jan 2023.
United States Courts. Confirmation Listing, Judicial Confirmations, 118th Congress. updated 24 Jul 2024.
United States Courts. Current Judicial Vacancies, 118th Congress. updated 24 Jul 2024.
United States Courts. Confirmation Listing, Judicial Confirmations for January 2019, 115th Congress. updated 1 Jan 2019.
United States Courts. Confirmation Listing, Judicial Confirmations for July 2020, 116th Congress. updated 1 Jul 2020.
Congress.gov. Senate Judiciary Committee nominations. accessed 24 Apr 2024.