Este artículo estará disponible en español en El Tiempo Latino.
Summary
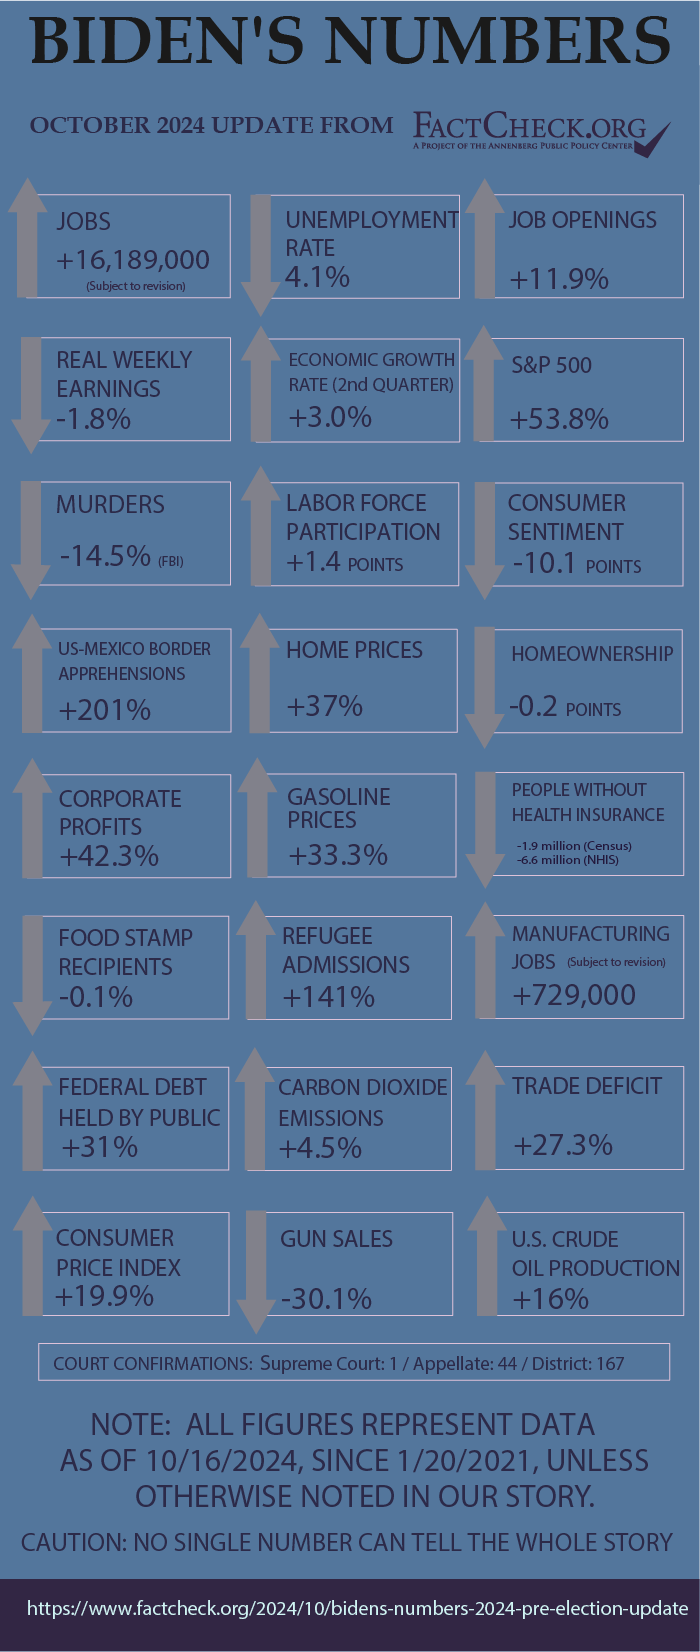
Here’s how the U.S. has fared since President Joe Biden took office:
- The economy has added more than 15 million jobs. The number is now about 6 million higher than before the pandemic. Unemployment is 4.1%
- The unemployment rate dropped back and has stayed lower, longer than at any time during the previous administration.
- Inflation spiked, hitting its highest level in over 40 years, then easing greatly. Overall, consumer prices are up nearly 20%. Gasoline is up 33%.
- Average weekly earnings haven’t kept pace with prices. After adjusting for inflation, “real” weekly earnings dropped 1.8%.
- After increasing the year before Biden took office, murders and violent crime have declined. The murder rate dropped 0.9 points, and the number dropped 14.5% from 2020 to 2023.
- All three major U.S. stock indexes have made significant gains this year. The S&P 500, which set a new high this week, is up nearly 54% under Biden.
- The percentage of Americans lacking health insurance declined. The drop was 0.6 percentage points, when measuring those who were uninsured for an entire year.
- The economy has been growing at a faster rate in recent years than initially thought, and continues to show unexpected resilience this year.
- Apprehensions at the southern border are up 201% for the 12 months ending in August, though they have dropped significantly since Biden implemented new border policies in June.
- More than 100,000 refugees resettled in the U.S. in fiscal year 2024 — the largest number in three decades.
- After-tax corporate profits continue to set records.
- The U.S. trade deficit during the most recent 12 months ending in August is about 27% higher than in 2020.
- The number of people receiving federal food assistance has declined only slightly.
- Federal debt has increased by 31%, and annual federal deficits rose in fiscal year 2024 for the second consecutive year.
- Even though inflation is easing and the economy is growing, consumer confidence remains stubbornly low.
- The U.S. is currently headed for a second consecutive year of record crude oil production.
- The U.S. is on pace for a fourth straight year in which estimated gun purchases declined.
Analysis
Although President Joe Biden is no longer a candidate for president, his vice president, Kamala Harris, is on the ballot — and, to a large extent, so is the Biden-Harris record. Here, we present our 10th quarterly update of “Biden’s Numbers,” which we first published in January 2022.
We did the same for Harris’ opponent, Donald Trump, when he was president. The full collection of “Trump’s Numbers” can be found here, and “Biden’s Numbers” is available here.
As we’ve said on other occasions, we make no judgements on how much credit or blame the president deserves for things that happen on his watch.
Jobs and Unemployment
The number of people with jobs rebounded strongly during Biden’s time, surpassing pre-pandemic levels by around 6 million.
Employment — The U.S. economy added more than 15 million jobs between Biden’s inauguration and September, the latest month for which data are available from the Bureau of Labor Statistics. The September figure is about 6 million higher than the February 2020 peak of employment before COVID-19 forced massive shutdowns and layoffs.
The exact figures are uncertain and won’t be known until February, when the BLS completes its yearly “benchmarking” process, through which it refines and adjusts its jobs figures using additional information that isn’t available as often or as quickly as its own monthly payroll survey data.
According to the regular monthly report, as of September total nonfarm employment has increased by 16,189,000 since Biden took office. But that total will be revised downward significantly once benchmarking is complete. By how much isn’t certain, but the BLS has issued a preliminary estimate that the March figure will eventually be reduced by 818,000, an unusually large adjustment.
If we subtract that preliminary March adjustment from the September figure, we get a job gain during Biden’s time of 15,371,000 jobs, which would be 5,978,000 above the pre-pandemic peak. But the actual adjustment won’t be made until next year.
Unemployment — The unemployment rate has been lower under Biden than under his predecessor.
It hit the lowest point in over half a century in January 2023 and again in April 2023, when it was 3.4%, the lowest since May 1969.
The rate was back up to 4.1% last month, still 2.3 percentage points below where it was when Biden took office.
Unlike the jobs figures, the unemployment figures won’t change. They are based on a survey of households, not the survey of payrolls that is revised annually through benchmarking.
Job Openings — The number of unfilled job openings soared, reaching a record of over 12 million in March 2022, but then declined after the Federal Reserve began a steep series of interest rate increases aimed at cooling the economy to bring down price inflation.
The number of unfilled jobs was still over 8 million as of the last business day of August, the most recent month on record. That’s an increase of 855,000 openings — just under 12% — compared with January 2021, when Biden took office.
In August there were more job vacancies than people seeking work. When Biden took office there were fewer job openings than people seeking employment.
The number of job openings in September is set to be released on Oct. 29.
Labor Force Participation — The labor force participation rate (the percentage of the total population over age 16 that is either employed or actively seeking work) has risen slowly during Biden’s time, from 61.3% in January 2021 to 62.7% in September.
That still leaves the rate 0.6 percentage points below the pre-pandemic level of 63.3% for February 2020.
The rate has been trending generally down for nearly a quarter of a century. It peaked at 67.3% during the first four months of 2000. Labor Department economists project that the rate will continue to slide down to 60.1% in 2031, “primarily because of an aging population.”
Manufacturing Jobs — During the presidential campaign, Biden promised he had a plan to create a million new manufacturing jobs — but he has fallen short.
As of September, the BLS monthly payroll survey indicated a gain of 729,000 manufacturing jobs during Biden’s time. However, that figure will eventually be reduced. The March figure will be reduced by 115,000 manufacturing jobs, according to the BLS preliminary benchmarking estimate. If the September figure is reduced by the same amount, that would leave a gain of only 614,000 under Biden.
That would actually be 26,000 lower than at the highest level during Trump’s time in office — which was in January 2019. But again, the eventual, officially revised figures won’t be published until February when the benchmarking process is complete.
Wages and Inflation
CPI — Inflation came roaring back under Biden. During his time in office, the Consumer Price Index rose 19.9%.
For a time, it was the worst inflation in decades. The 12 months ending in June 2022 saw a 9.1% increase in the CPI (before seasonal adjustment), which the BLS said was the biggest such increase since the 12 months ending in November 1981.
Since then, inflation has moderated greatly. The CPI rose only 2.4% in the 12 months ending in September, the most recent figure available.
Gasoline Prices — The price of gasoline shot up even faster than other items.
During the week ending Oct. 14, the national average price of regular gasoline at the pump was $3.17 per gallon. That’s 79 cents higher than in the week before Biden took office, an increase of 33%.
The price swung wildly during Biden’s first year and a half, hitting just over $5 per gallon in the week ending June 13, 2022. That’s the highest on record. That rise was propelled by worldwide supply and demand issues due to the COVID-19 pandemic and then by Russia’s invasion of Ukraine on Feb. 24, 2022.
Wages — Wages also have gone up under Biden, but not as fast as prices.
Average weekly earnings for rank-and-file workers went up 18% during Biden’s first 44 months, according to figures compiled by the BLS. Those production and nonsupervisory workers make up 81% of all employees in the private sector.
But inflation ate up all that gain and more. In September, “real” weekly earnings, which are adjusted for inflation and measured in dollars valued at their average level in 1982-84, were still 1.8% below where they were when Biden took office.
That’s despite more than two years of recent improvement. Real earnings in September were 2.8% higher than the low point under Biden in June 2022.
Economic Growth
The U.S. economy has been growing at a faster rate in recent years than initially thought, and continues to show unexpected resilience in the second quarter of this year.
The Bureau of Economic Analysis roughly every five years conducts what it calls “comprehensive (or benchmark) updates.” On Sept. 26, the BEA announced that the real gross domestic product (which is adjusted for inflation) had increased by 2.9% last year, revised up from an estimated 2.5%. The BEA also upgraded its earlier estimates for 2022 (from 1.9% to 2.5%) and 2021 (from 5.8% to 6.1%), as well as from 2.5% to 2.6% for 2019, when Trump was president.
On the same day, the BEA announced that real GDP increased at an annual rate of 3% in the second quarter, fueled by “an acceleration in consumer spending” and “an upturn” in business investment. It was the third estimate issued by the BEA, and a bit higher than the 2.8% in the first, or advanced, estimate that we included in our July report.
“Overall, the (GDP) release looks like a very strong real economy with an especially strong household sector but also forward-looking businesses appearing very optimistic,” Jason Furman, a Harvard University economics professor who was a top economic adviser to former President Barack Obama, said on X when the second estimate for the second quarter was issued in late August.
In the latest Survey of Professional Forecasters — a quarterly survey conducted by the Federal Reserve Bank of Philadelphia and released in early August — economists projected a 2.6% increase in real GDP growth for the full year, up from an estimated 2.5% in May.
In its October monthly update, the Conference Board – a research organization with more than 2,000 member companies – said the U.S. economy continues to show unexpected strength.
“US economic data continue to surprise to the upside, revealing ongoing resilience despite looming uncertainties and persistent shocks,” the board said in an Oct. 11 press release. “We now expect real GDP to expand by 2.5 percent year-over-year in 2024, an upward revision from 2.4 percent.”
Even though there have been persistent concerns about high inflation and the Federal Reserve’s policy of raising interest rates to slow inflation, the U.S. economy has expanded by at least 2.5% every year under Biden. The economy also grew by 2.5% or more in Trump’s first three years prior to the pandemic’s crippling economic impact.
The BEA will release the advance estimate for the third quarter on Oct. 30.
Health Insurance
The percentage and number of Americans without health insurance has gone down under Biden.
From 2020 to 2023, the decline was 2.1 percentage points, according to the National Health Interview Survey, which measures the uninsured at the time people were interviewed. The drop was 0.6 percentage points, according to the Census Bureau’s annual reports, which measure those who lacked insurance for the entire year.
The NHIS, a project of the National Center for Health Statistics at the Centers for Disease Control and Prevention, found that 7.6% of the population was uninsured in 2023, down from 9.7% in 2020. In raw numbers, it was a decline of 6.6 million people.
The Census Bureau’s report for 2023 was released last month. It found that 8% of Americans, or 26.4 million people, lacked insurance for all of last year. In 2020, 8.6% of the population, or 28.3 million people, were uninsured.
We have been noting that the uninsured figures could begin to rise, since some Medicaid provisions that were enacted during the COVID-19 pandemic started to be phased out at the end of March 2023. So far, that hasn’t shown up in the available figures. Both NHIS and Census found no significant change from 2022 to 2023.
Enrollment in the Affordable Care Act’s marketplace plans has grown by 10 million people from 2020 to the end of the open enrollment period this year. Expanded subsidies for ACA plans, enacted by the Biden administration, are set to expire at the end of 2025.
Crime
Violent crime has decreased during Biden’s time in office, according to FBI crime statistics and those compiled by other sources. Annual figures for 2023, released last month, show a decline in the number and rate per 100,000 population for nationwide violent crime overall, as well as for murder and nonnegligent manslaughter, rape, robbery and aggravated assault.
Property crimes went down as well, with the exception of motor vehicle thefts, which increased.
The 2023 violent crime rate of 363.8 per 100,000 population is 22.5 points lower than it was in 2020, the year before Biden took office. The nationwide murder and nonnegligent manslaughter rate dropped 0.9 points, from 6.8 in 2020 to 5.7 last year. The number of murders declined by 14.5%.
The aggravated assault rate decreased by 13.6 points.
The property crime rate dropped by 50.2 points, to 1,916.7 property crimes per 100,000 people in 2023. The motor vehicle theft rate jumped up 70.6 points, to 318.7. (For these figures, see Table 1 after downloading the CIUS Estimations file.)
Despite this data, Trump and other Republicans have continued to falsely claim that violent crime has gone up under Biden. Instead, what the statistics from several sources consistently show is a spike in violent crime overall in 2020, Trump’s last year in office, due to increases in murders and aggravated assaults. Experts have said that the COVID-19 pandemic, and the accompanying loss of jobs, is one factor behind the increases that year.
As we said, violent crime has declined since then. Law enforcement agencies nationwide voluntarily submit data to the FBI, which said agencies representing 94.3% of the U.S. population provided statistics for 2023.
Other reports on crime data have echoed the FBI findings and show a continued drop in violent crime in 2024. The Major Cities Chiefs Association reports, with the addition of New York City’s statistics, show a 9.1% decrease in the number of murders in 70 large U.S. cities from 2020 to 2023. For the first half of 2024, compared with the same period last year, murders are down 17.4% in 69 cities. In New York, murders through Oct. 6 this year are also down compared with the same time period in 2023.
As of early October, AH Datalytics, an independent criminal justice data analysis group, reports a 17.9% decrease in murders in more than 250 U.S. cities so far this year, compared with the same points in 2023.
Stock Market
All three major U.S. stock indexes have made significant gains this year.
The S&P 500, which is made up of 500 large-cap companies, and the Dow Jones Industrial Average, which includes 30 large corporations, set new highs this week.
The S&P is now 53.8% higher than it was on Jan. 19, 2021, the day before Biden took office. For the year, it is up 22.5%.
The Dow, which is up 14.3% for the year, has seen slightly smaller gains than the S&P 500 under Biden. It has increased 39.3% since Biden became president, topping 43,000 for the first time twice this week.
For the year, the Nasdaq composite index, which is made up of more than 2,500 companies, is up 22.4%. Overall, it was up 39.2% under Biden, closing on Oct. 16 at 18,367.08 — up more than 1,000 points since our July quarterly report.
Border Security
Illegal border crossings have plummeted since Biden implemented new emergency policies to deal with high levels of illegal immigration. Since our last report, apprehensions in July, August and September — the latest available data — were lower than during the last three months under Trump.
But, as we’ve noted before, illegal border crossings are up substantially over Biden’s entire presidency.
For “Biden’s Numbers,” we compare the number of apprehensions of illegal border crossers during the most recent 12 months with the year before Biden took office. For the last 12 months ending in September, apprehensions totaled 1,530,586, according to Customs and Border Protection. That’s 201% higher than during Trump’s last year in office.
As we said, the picture at the border has changed dramatically since our last quarterly update. Apprehensions of immigrants crossing the border illegally between ports of entry were 56,399 in July, 58,038 in August and 53,881 in September. That’s a huge drop from the peak of 249,741 in December 2023. It’s also 20% fewer than the last three full months under Trump.
The recent drop comes after Biden on June 4 announced a series of executive actions designed to address “substantial levels of migration” due to “global conditions” — including “failing regimes and dire economic conditions,” “violence linked to transnational criminal organizations” and “natural disasters” in some countries in Central and South America. Specifically, the proclamation directs border officials to temporarily restrict asylum eligibility and promptly remove many who cross the border illegally between ports of entry when the daily average of encounters reaches 2,500 or more for seven straight days. The policy was immediately implemented on June 5 because levels were already well above that. (For more on the policy, see our story “Q&A on Biden’s Border Order.”)
But it isn’t just Biden’s emergency policies affecting traffic at the border, Colleen Putzel-Kavanaugh, associate policy analyst at the Migration Policy Institute, told us via email.
“Since this past January, irregular border crossings have dropped nearly every month, precipitously so after the June executive action,” Putzel-Kavanaugh said. “As a result, unauthorized crossings have been the lowest they have been during this administration. While the June executive action further narrowing access to asylum is certainly a component of the drop in irregular border crossings, factors like stepped-up Mexican enforcement also play a big role.”
A number of immigrant rights groups have joined in a lawsuit against the Biden administration that claims the president’s emergency border proclamation illegally restricts asylum. The case is ongoing.
Meanwhile, in an address on border policy in Arizona on Sept. 27, Harris said she would go even further than Biden to clamp down on illegal immigration.
“Those who cross our borders unlawfully will be apprehended and removed and barred from reentering for five years,” Harris said. “We will pursue more severe criminal charges against repeat violators. And if someone does not make an asylum request at a legal point of entry and instead crosses our border unlawfully, they will be barred from receiving asylum.”
One further caveat to the border apprehensions is important: While apprehensions of immigrants attempting to cross the border illegally between ports of entry have plummeted in recent months, the number of encounters of immigrants by the Office of Field Operations remains high. These are the immigrants who come to the U.S. border at ports of entry. In January 2023, in order to facilitate a safer and more orderly process, the Biden administration began accepting CBP One mobile app applications that allow immigrants to set up appointments to request asylum or parole and be screened for entry to the U.S.
CBP allows up to 1,450 such appointments per day. So, while the number of illegal crossings is down, the number of immigrants coming through ports of entry has hovered around 50,000 per month for a little over a year. In the last three months under Trump, those kinds of encounters were under 3,000 a month.
“This is actually a sign that the strategy to disincentivize unauthorized crossings and encourage people to present themselves at a port of entry is working,” Putzel-Kavanaugh said. “Things are much more predictable and quieter at the border now than they were in 2022 and 2023. The question is whether that will continue, given key components of this strategy are under challenge in the courts, Mexico could change its enforcement strategy, and migration patterns are always evolving.”
Refugees
In fiscal year 2024, which ended Sept. 30, the Department of State admitted 100,034 refugees — the largest number in three decades.
Although it is less than the 125,000 refugees that Biden pledged to accept as a candidate, the fiscal year 2024 number marked the first time since FY 1994 that the U.S. admitted more than 100,000 refugees, according to the data compiled by the Migration Policy Institute.
The State Department has been making steady progress each fiscal year toward the president’s goal. In fiscal year 2023, the U.S. accepted 60,014 refugees — the highest total since fiscal year 2016, which was the last full fiscal year of the Obama-Biden administration, according to State Department data, which dates to FY 2001. Only 25,465 refugees were admitted in fiscal 2022 and 11,411 in fiscal 2021, which spanned both the Biden and Trump administrations, the department data show.
Overall, the Biden administration has admitted 195,521 refugees in its first full 44 months in office from February 2021 through September 2024. That’s a monthly average of 4,444 refugees — 141% higher than Trump’s monthly average of 1,846 in 47 full months from February 2017 through December 2020.
Biden has again set the target for refugee admissions at 125,000 for fiscal year 2025, which began Oct. 1.
In a statement, the U.S. Conference of Catholic Bishops, which assists in resettling refugees in the United States, called the resettling of more than 100,000 refugees a “significant achievement, given the all-time low number seen in 2021.” It also praised Congress for funding the program.
“We appreciate the efforts undertaken by the Biden Administration in recent years to reassert and grow our nation’s proud tradition of welcoming refugees,” Bishop Mark Seitz, who chairs the U.S. bishops’ migration committee, said in the statement. “This would not be possible without the bipartisan support of Congress, which has played a vital role in the success of the resettlement program since its inception.”
Corporate Profits
After-tax corporate profits have now increased for six straight quarters.
Corporate profits were running at an annual rate of more than $3.4 trillion in the second quarter of 2024, according to the BEA’s most recent estimate. That’s up from $3.3 trillion in the first quarter, and 42.3% higher than in the fourth quarter of 2020, the last quarter before Biden took office. (See line 45.)
For the year, after-tax corporate profits set records in 2021, 2022 and 2023, according to the latest BEA estimates, which were also revised in September as part of the bureau’s five-year comprehensive updates. The BEA estimated that profits in 2023 were $3.07 trillion — up from $2.95 trillion in 2022.
Consumer Sentiment
Even though inflation is easing and the economy is growing, consumer confidence has been relatively unchanged since our last report.
The University of Michigan’s Surveys of Consumers reported that its preliminary Index of Consumer Sentiment for October was 68.9 — down from 70.1 in the previous month. In our last report, the preliminary July index of consumer sentiment was 66, and the final July number was little changed at 66.4, historical survey data show.
“While inflation expectations have eased substantially since then, consumers continue to express frustration over high prices,” Joanne W. Hsu, director of the Surveys of Consumers, said in a press release.
Hsu noted that the preliminary October figure is nearly 40% higher than the low under Biden, which occurred in June 2022. However, it is 10.1 points lower than January 2021, when Biden took office and the index was 79, the data show.
In its most recent Consumer Confidence Survey, the Conference Board also reported that consumer confidence weakened in September.
Home Prices & Homeownership
Home prices — The preliminary median sales price of existing single-family homes in August was $422,100 — down from a record high of $432,900 in June, according to the National Association of Realtors.
The preliminary June figure is 37% higher than the $308,000 median home price in January 2021, when Biden took office.
In our July report, we noted that the average 30-year fixed rate mortgage fell to 6.77% – which is below the historical norm of 7.7% dating to April 1971. In mid-September, the Federal Reserve cut interest rates for the first time in four years and the 30-year fixed rate mortgage fell to 6.08% in the week of Sept. 26, according to Freddie Mac. But it has since popped up to 6.32%, as of Oct. 10, according to Freddie Mac.
Similarly, Bankrate’s lender survey found that the average 30-year fixed rate mortgage rate had jumped to 6.52%, as of Oct. 9.
“I am spending a lot of time telling people that I expect rates to drop but not as quickly as they would like,” Melissa Cohn, regional vice president of William Raveis Mortgage, told Bankrate.
Homeownership — Homeownership rates remain unchanged since our last report. In fact, the rate has barely changed at all since Biden became president.
The homeownership rate, which the Census Bureau measures as the percentage of “occupied housing units that are owner-occupied,” was 65.6% in the second quarter of 2024 — matching the first quarter rate.
After more than three years, the rate is just 0.2 points below the 65.8% rate during Trump’s last quarter in office.
The rate under Trump peaked in the second quarter of 2020 at 67.9%, but the U.S. Department of Housing and Urban Development’s Office of Policy Development and Research warns that data from the second quarter of 2020 through the third quarter of 2021 “should be viewed with caution” because restrictions during the COVID-19 pandemic “prevented normal data collection.”
“These changes in survey methods,” including the suspension of in-person surveys in the second quarter of 2020, “likely contributed to wide swings in the data,” HUD’s policy and research arm says on its website. For this reason, the Census Bureau has warned against making comparisons with the fourth quarter of 2020.
The highest homeownership rate on record was 69.2% in 2004, when George W. Bush was president.
Trade
The BEA’s most recent figures show that the U.S. imported about $832 billion more in goods and services than it exported during the most recent 12 months ending in August. The international trade gap in that time was roughly $178.3 billion, or about 27%, higher than in 2020.
The trade deficit in goods and services was $575.8 billion through the first eight months of 2024. That’s $47.1 billion, or 8.9%, higher than it was during the same period in 2023. The $784.9 billion trade deficit last year was the lowest during the Biden administration.
Food Stamps
The number of people receiving federal food assistance has declined only slightly under Biden.
In July, the most recent figures available, there were just under 42.1 million people receiving benefits from the Supplemental Nutrition Assistance Program, according to preliminary statistics released by the Department of Agriculture on Oct. 11. The total was down 49,075, or 0.1%, from the enrollment in January 2021.
July was the fifth straight month in which the number of beneficiaries receiving “food stamps” increased, and the enrollment figure has been above 41 million since July 2022.
Income and Poverty
Household income — For the first time under Biden, household income went up in 2023.
The real median household income was $80,610 last year, according to Census Bureau estimates published in September. That was an increase of $3,070, or almost 4%, from 2020, when factoring in inflation.
(The median figure represents the midpoint — half of all households earned more, half less.)
The increase followed three consecutive years of income decreases for households, starting in 2020. However, the 2023 estimate was still below the pre-pandemic record high in 2019.
Also, only white and non-Hispanic white households saw their incomes rise significantly last year.
“Real median household incomes increased by 5.4 percent for White households and by 5.7 percent for non-Hispanic White households between 2022 and 2023,” the bureau said. “There was no significant change in median incomes for Black, Asian, and Hispanic households.”
Poverty — In addition, the official poverty rate, which is based on an individual’s or family’s pretax cash income, went down for the second straight year under Biden. The rate of 11.1% in 2023 declined 0.4 percentage points from 2022, as well as 2020, when the rate was 11.5% both years, according to the Census Bureau’s estimates.
Based on raw numbers, there were almost 37.8 million people below the poverty line in 2023 compared with about 36.6 million in 2020.
On the other hand, the Census Bureau’s alternative estimate, the Supplemental Poverty Measure, showed another increase in poverty last year.
Unlike the official poverty rate, the SPM, which was introduced in 2011, factors in government programs that benefit low-income families and individuals, such as food, housing and energy assistance, as well as tax credits and stimulus payments. The SPM also considers other necessary expenses, such as medical costs, and regional differences in the cost of living.
The supplemental poverty rate was 12.9% in 2023 — up from 12.4% in 2022, 7.8% in 2021 and 9.2% in 2020. In 2019, before the COVID-19 pandemic, the supplemental rate was 11.8%. It started increasing in 2022, after stimulus payments and tax credits that were in effect during the pandemic were no longer available.
Debt and Deficits
Debt — Since our last quarterly update, the public debt, which excludes money the government owes itself, increased to nearly $28.4 trillion, as of Oct. 11. During Biden’s presidency, the debt held by the public has gone up by about $6.7 trillion and is now 31% higher than when Biden took office.
Deficits — The federal deficit was over $1.8 trillion in fiscal year 2024, which ended Sept. 30, according to estimates published by the Congressional Budget Office in its Monthly Budget Review for September. The deficit “was $139 billion more than the shortfall recorded during fiscal year 2023,” the CBO said.
While revenues increased by $479 billion, spending went up $617 billion, according to the preliminary analysis. This would be the second consecutive year that the annual deficit has increased.
Biden regularly took too much credit for the deficit declining from a record $3.1 trillion in fiscal year 2020 to $1.4 trillion in FY 2022. But now deficits are going up again.
The Treasury Department is expected to release its own report this month with the official deficit figure. In September, the Treasury said that the shortfall through the first 11 months of fiscal year 2024 was closer to $1.9 trillion.
Oil Production and Imports
For the most recent 12 months ending in July, crude oil production averaged more than 13.1 million barrels per day, according to Energy Information Administration data released last month. That was about 16% higher than the average daily amount of crude oil produced in 2020.
The U.S. is currently headed for a second consecutive year of record production after averaging over 12.9 million barrels per day in 2023. In its October Short-Term Energy Outlook report, the Energy Information Administration projected that crude oil production would average 13.2 million barrels per day in 2024 — higher than the more than 12.3 million barrels per day in 2019, which was the record before Biden took office.
The EIA has partly attributed the increase in production in the U.S. to better well productivity, particularly in the Permian region in western Texas and eastern New Mexico, due to “significant efficiency gains and technological advancements in the drilling and completion process.”
In addition to increased production, the U.S. also is importing more crude oil. Imports of crude oil averaged almost 6.7 million barrels per day over the same 12-month period, which is up nearly 13.4% from average daily imports in 2020.
Carbon Emissions
EIA data show that in the most recent 12 months through June, there were about 4.79 billion metric tons of emissions from the consumption of coal, natural gas and petroleum products in the U.S. That’s up over 4.5% from the 4.58 billion metric tons that were emitted in 2020, but it’s down about 6.9% from the pre-pandemic total of roughly 5.15 billion metric tons of emissions in 2019.
In the EIA’s October forecast, the agency projected that U.S. energy consumption will lead to 4.78 billion metric tons of emissions in 2024, noting that an increase in natural gas emissions will be offset by a decrease in emissions from coal.
Gun Sales
Year over year, gun purchases may have increased during the third quarter of 2024, based on estimates from the National Shooting Sports Foundation.
Since the federal government doesn’t collect data on gun sales, the NSSF, a gun industry trade group, estimates gun sales by tracking the number of background checks for firearm sales based on the FBI’s National Instant Criminal Background Check System, or NICS. The NSSF-adjusted figures exclude background checks unrelated to sales, such as those required for concealed-carry permits.
The group’s adjusted NICS total for background checks during the third quarter of the year was over 3.43 million, which is about 4.5% higher than the more than 3.28 million in the third quarter of 2023. However, it’s still about 39% lower than the almost 5.63 million in Trump’s last full quarter in 2020.
Over the first nine months of 2024, there were about 10.78 million background checks for firearm sales. Not only is that down about 30% from the same period in 2020, it means that the U.S. is on pace for a fourth straight year in which estimated gun purchases declined.
Judiciary Appointments
Supreme Court — Biden has appointed one Supreme Court Justice — Ketanji Brown Jackson, who was confirmed by the Senate on April 7, 2022. She replaced an appointee of President Bill Clinton, Justice Stephen G. Breyer, who retired. Trump had won confirmation for two justices at the same point of his tenure. However, a third justice — Amy Coney Barrett — was confirmed by the Senate on Oct. 26, 2020.
Court of Appeals — Biden has won confirmation for 44 U.S. Court of Appeals judges. Trump had won confirmation for 53 at the same point of his term.
District Court — Biden has won confirmation for 167 District Court judges (our count includes confirmation for the reappointment of the chief judge of the District Court for the Northern Mariana Islands). At the same point in his presidency, Trump had won confirmation for 162 District Court judges.
Five U.S. Court of Federal Claims judges have also been confirmed under Biden, while six had been confirmed at the same point of Trump’s presidency. Biden has won the confirmation for two U.S. Court of International Trade judges, and Trump also won confirmation for two judges at the same point of his term.
As of Oct. 16, there were 44 federal court vacancies, with 15 nominees pending.
Editor’s note: FactCheck.org does not accept advertising. We rely on grants and individual donations from people like you. Please consider a donation. Credit card donations may be made through our “Donate” page. If you prefer to give by check, send to: FactCheck.org, Annenberg Public Policy Center, P.O. Box 58100, Philadelphia, PA 19102.
Sources
Keisler-Starkey, Katherine and Lisa N. Bunch. “Health Insurance Coverage in the United States: 2021.” Census Bureau. 13 Sep 2022.
Keisler-Starkey, Katherine and Lisa N. Bunch. “Health Insurance Coverage in the United States: 2023.” Census Bureau. 10 Sep 2024.
Tolbert, Jennifer and Meghana Ammula. “10 Things to Know About the Unwinding of the Medicaid Continuous Enrollment Provision.” KFF. 5 Apr 2023.
Centers for Disease Control and Prevention; National Health Interview Survey. “Health Insurance Coverage: Early Release of Estimates From the National Health Interview Survey, 2023.” Jun 2024.
Department of Health and Human Services. “Health Insurance Marketplaces 2024 Open Enrollment Report.” 22 Mar 2024.
Ortaliza, Jared. “Inflation Reduction Act Health Insurance Subsidies: What is Their Impact and What Would Happen if They Expire?” KFF. 26 Jul 2024.
Federal Bureau of Investigation. FBI Releases 2023 Crime in the Nation Statistics. press release. 23 Sep 2024.
Federal Bureau of Investigation. Crime Data Explorer. Crime in the United States Annual Reports, CIUS estimations, Table 1. accessed 12 Oct 2024.
Major Cities Chiefs Association. Violent Crime Survey — National Totals, January 1 to December 31, 2023, and 2022. Accessed 22 Jan 2024.
Major Cities Chiefs Association. Violent Crime Survey — National Totals, January 1 to December 31, 2020, and 2019. Accessed 22 Jan 2024.
Major Cities Chiefs Association. Violent Crime Survey — Midyear Comparison, January 1 to June 30, 2024 and 2023. Accessed 12 Oct 2024.
New York City government. New York Police Department historical crime data. Seven Major Felony Offenses, 2000 to 2023. accessed 12 Oct 2024.
New York City government. New York Police Department. Crime complaints, report covering the week 9/30/24 through 10/6/24. accessed 12 Oct 2024.
AH Datalytics. YTD Murder Comparison. accessed 16 Oct 2024.
United States Courts. Confirmation Listing, Judicial Confirmations for January 2023, 117th Congress. Updated 1 Jan 2023.
United States Courts. Confirmation Listing, Judicial Confirmations, 118th Congress. updated 16 Oct 2024.
United States Courts. Current Judicial Vacancies, 118th Congress. updated 16 Oct 2024.
United States Courts. Confirmation Listing, Judicial Confirmations for January 2019, 115th Congress. updated 1 Jan 2019.
United States Courts. Confirmation Listing, Judicial Confirmations for November 2020, 116th Congress. updated 1 Jul 2020.
Congress.gov. Nomination of Ramona Villagomez Manglona. 16 Apr 2024.
U.S. Bureau of Labor Statistics. “Employment, Hours, and Earnings from the Current Employment Statistics survey (National): Total Nonfarm.” Accessed 12 Oct 2024.
U.S. Bureau of Labor Statistics. “Labor Force Statistics from the Current Population Survey: Unemployment.” Accessed 12 Oct 2024.
U.S. Bureau of Labor Statistics. “Job Openings and Labor Turnover Survey: Job Openings.” Accessed 12 Oct 2024.
U.S. Bureau of Labor Statistics. “Labor Force Statistics from the Current Population Survey: Labor Force Participation Rate.” Accessed 12 Oct 2024.
U.S. Bureau of Labor Statistics. Monthly Labor Review. “Projections overview and highlights, 2021–31” Nov 2022.
U.S. Bureau of Labor Statistics. “Employment, Hours, and Earnings from the Current Employment Statistics survey (National): Manufacturing.” Accessed 12 Oct 2024.
U.S. Bureau of Labor Statistics. “Employment, Hours, and Earnings from the Current Employment Statistics survey (National): Manufacturing.” Accessed 12 Oct 2024.
U.S. Bureau of Labor Statistics. “Consumer Price Index – All Urban Consumers (Seasonally Adjusted).” Data extracted 12 Oct 2024.
U.S. Bureau of Labor Statistics. Consumer Price Index Summary. News release. 13 Jul 2022.
U.S. Energy Information Administration. “Weekly U.S. Regular All Formulations Retail Gasoline Prices.” Data extracted 16 Oct 2024.
Bureau of Labor Statistics. “Employment, Hours and Earnings from the Current Employment Statistics survey (National); Average Weekly Earnings of Production and Nonsupervisory Employees, total private.” Data extracted 12 Oct 2024.
Bureau of Labor Statistics. “Employment, Hours and Earnings from the Current Employment Statistics survey (National); Average Weekly Earnings of Production and Nonsupervisory Employees, 1982-1984 dollars, total private.” Data extracted 12 Oct 2024.
Bureau of Labor Statistics. “CES Preliminary Benchmark Announcement” 21 Aug 2024.
National Association of Realtors. “Sales Price of Existing Single-Family Homes.” 19 Sep 2024.
National Association of Realtors. “Sales Price of Existing Single-Family Homes.” 22 Dec 2021.
Tepper, Taylor and Benjamin Curry. “Federal Funds Rate History 1990 to 2023.” Forbes Advisor. 17 Oct 2023.
“Mortgage Rates Surge.” Press release. Freddie Mac. 10 Oct 2024.
“Primary Mortgage Market Survey.” Freddie Mac. Accessed 16 Oct 2024.
Cox, Jef. “Fed slashes interest rates by a half point, an aggressive start to its first easing campaign in four years.” CNBC. 18 Sep 2024.
Ostrowski, Jeff. “Mortgage rates rise again, despite Fed’s cut.” Bankrate. 9 Oct 2024.
U.S. Census Bureau. “Business and Industry: Homeownership rates.” Accessed 16 Oct 2024.
Mateyka, Peter, and Mazur, Christopher. “Homeownership in the United States: 2005 to 2019.” U.S. Census Bureau. Mar 2021.
U.S. Department of Housing and Urban Development. “Ownership and Vacancy — Homeownership Rate.” Undated, accessed 24 Jul 2024
U.S. Census Bureau. “Quarterly Residential Vacancies And Homeownership, Fourth Quarter 2021.” 2 Feb 2022.
U.S. Bureau of Economic Analysis. “2024 Annual Update of the National Economic Accounts.” 26 Sep 2024.
U.S. Bureau of Economic Analysis. “Gross Domestic Product (Third Estimate), Corporate Profits (Revised Estimate), and GDP by Industry, Second Quarter 2024 and Annual Update.” 26 Sep 2024.
U.S. Bureau of Economic Analysis. “Gross Domestic Product, Second Quarter 2024 (Advance Estimate).” 25 Jul 2024.
U.S. Bureau of Economic Analysis. “National Income by Type of Income.” Accessed 16 Oct 2024.
Federal Reserve Bank of Philadelphia. “Third Quarter 2024 Survey of Professional Forecasters.” 9 Aug 2024.
University of Michigan. “Preliminary Results for October 2024.” Surveys of Consumers. Accessed 14 Oct 2024.
University of Michigan. “Preliminary Results for July 2024.” Surveys of Consumers. Accessed 16 Jul 2024.
University of Michigan. “The Index of Consumer Sentiment.” Surveys of Consumers. Accessed 10 Sep 2024.
Conference Board. “Consumer Confidence Weakened as Consumers Worry About Jobs.” Press release. 24 Oct 2024.
Conference Board. “US Economy Displays Continued Resilience.” Press release. 11 Oct 2024.
Harris, Ben. “What is inflation, and why has it been so high?” Brookings Institution. 3 Apr 2024.
“The Biden Plan for Securing Our Values as a Nation of Immigrants.” Biden campaign. Undated, accessed 5 Jan 2022.
“U.S. Annual Refugee Resettlement Ceilings and Number of Refugees Admitted, 1980-Present.” Migration Policy Institute. Updated, accessed 6 Oct 2023.
State Department. “Presidential Determination on Refugee Admissions for Fiscal Year 2025.” 30 Sep 2024.
United States Conference of Catholic Bishops. “Bishop Seitz Expresses Gratitude for U.S. Catholic Community’s Life-Saving Contributions to Refugee Resettlement.” 2 Oct 2024.
State Department. “Admissions & Arrivals.” Refugee Processing Center. 30 Sep 2024.
French, David. “S&P 500 ends at fresh record high, as Dow scales 43k for first time.” Reuters. 14 Oct 2024.
Yahoo! Finance. “NASDAQ Composite.” Accessed 16 Oct 2024.
Yahoo! Finance. “Dow Jones Industrial Average.” Accessed 16 Oct 2024.
Yahoo! Finance. “S&P 500.” Accessed 16 Oct 2024.
U.S. Bureau of Economic Analysis. “Table 1.12. National Income by Type of Income.” Accessed 14 Oct 2024.